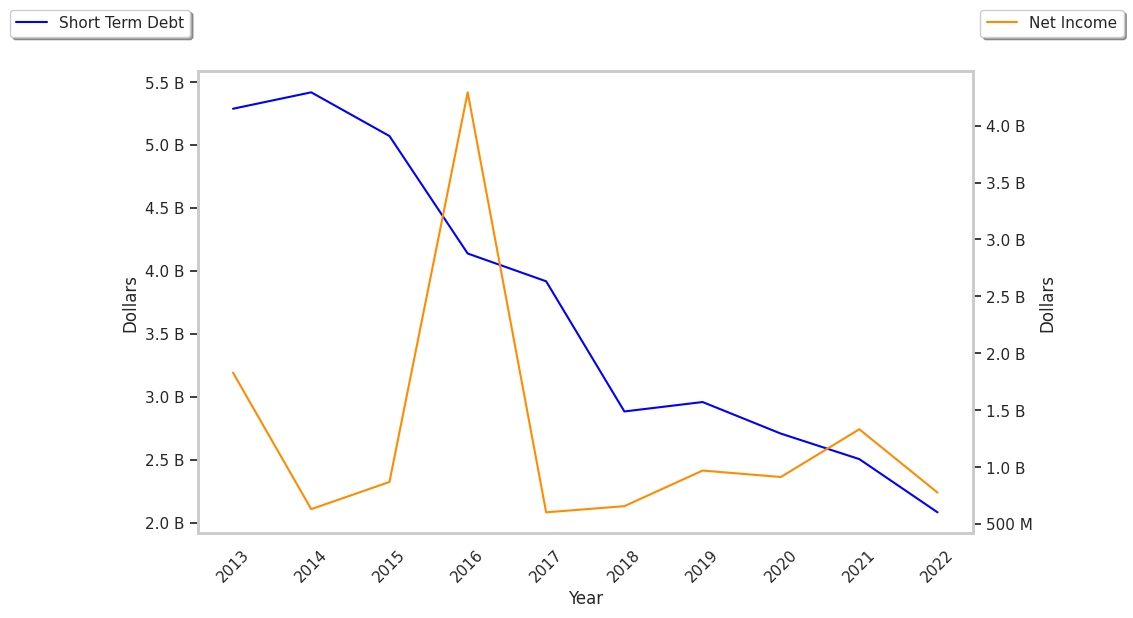
Today we're going to take a closer look at Large-Cap Real Estate company Equity Residential, whose shares are currently trading at $65.4. We've been asking ourselves whether the company is under or over valued at today's prices... let's perform a brief value analysis to find out!
a Decline in Expected Earnings Clouds Its Value Outlook but Trading Above Its Fair Price:
Equity Residential is committed to creating communities where people thrive. The company belongs to the Real Estate sector, which has an average price to earnings (P/E) ratio of 27.31 and an average price to book (P/B) ratio of 1.94. In contrast, Equity Residential has a trailing 12 month P/E ratio of 24.6 and a P/B ratio of 2.26.
Equity Residential has moved -15.6% over the last year compared to 17.4% for the S&P 500 — a difference of -33.0%. Equity Residential has a 52 week high of $78.37 and a 52 week low of $59.41.
The Company's Revenues Are Declining:
| 2019 | 2020 | 2021 | 2022 | 2023 | 2024 | |
|---|---|---|---|---|---|---|
| Revenue (k) | $2,701,075 | $531,807 | $1,072,183 | $304,325 | $282,539 | $546,797 |
| Net Income (k) | $1,009,708 | $962,501 | $1,396,714 | $806,995 | $868,488 | $1,070,975 |
| Net Interest Expense (k) | $390,076 | $365,073 | $272,473 | $282,920 | $269,556 | $285,735 |
| Depreciation & Amort. (k) | $831,083 | $820,832 | $838,272 | $882,168 | $888,709 | $952,191 |
| Diluted Shares (k) | 386,333 | 385,874 | 388,089 | 389,450 | 390,897 | 390,740 |
| Earnings Per Share | $2.6 | $2.45 | $3.54 | $2.05 | $2.2 | $2.72 |
| EPS Growth | n/a | -5.77% | 44.49% | -42.09% | 7.32% | 23.64% |
| Avg. Price | $68.14 | $55.87 | $72.18 | $79.03 | $61.16 | $65.28 |
| P/E Ratio | 26.11 | 22.8 | 20.28 | 38.36 | 27.8 | 23.91 |
| Free Cash Flow (k) | $1,261,292 | $1,035,204 | $1,053,763 | $1,345,411 | $1,454,601 | $1,443,785 |
| CAPEX (k) | $195,692 | $230,332 | $206,421 | $109,345 | $78,197 | $129,822 |
| EV / EBITDA | 15.68 | 13.5 | 14.0 | 18.59 | 14.92 | 16.18 |
| Total Debt (k) | $9,130,979 | $8,126,903 | $8,421,172 | $7,494,250 | $7,464,657 | $8,193,052 |
| Net Debt / EBITDA | 4.15 | 3.78 | 3.3 | 3.72 | 3.62 | 4.0 |


