VICI Properties logged a -1.2% change during today's afternoon session, and is now trading at a price of $32.67 per share.
Over the last year, VICI Properties logged a -1.9% change, with its stock price reaching a high of $34.17 and a low of $27.98. Over the same period, the stock underperformed the S&P 500 index by -19.3%. AThe company's 50-day average price was $33.13. VICI Properties Inc. is an S&P 500 experiential real estate investment trust that owns one of the largest portfolios of market-leading gaming, hospitality, wellness, entertainment and leisure destinations, including Caesars Palace Las Vegas, MGM Grand and the Venetian Resort Las Vegas, three of the most iconic entertainment facilities on the Las Vegas Strip. Based in New York, NY, the Large-Cap Real Estate company has 27 full time employees. VICI Properties has offered a 5.2% dividend yield over the last 12 months.
Exceptional Profitability Overshadowed by Excessive Leverage:
| 2019 | 2020 | 2021 | 2022 | 2023 | 2024 | |
|---|---|---|---|---|---|---|
| Revenue (M) | $895 | $1,226 | $1,510 | $2,601 | $3,612 | $3,849 |
| Operating Margins | 6% | 73% | 68% | 44% | 71% | 71% |
| Net Margins | 61% | 73% | 67% | 43% | 70% | 70% |
| Net Income (M) | $546 | $892 | $1,014 | $1,118 | $2,514 | $2,679 |
| Net Interest Expense (M) | $248 | $309 | $392 | $540 | $818 | $781 |
| Depreciation & Amort. (M) | $4 | $4 | $3 | $3 | $4 | $4 |
| Diluted Shares (M) | 439 | 511 | 577 | 880 | 1,016 | 1,048 |
| Earnings Per Share | $1.24 | $1.75 | $1.76 | $1.27 | $2.47 | $2.56 |
| EPS Growth | n/a | 41.12903225806452% | 0.571428571428572% | -27.84090909090909% | 94.48818897637796% | 3.6437246963562693% |
| Avg. Price | $18.12 | $19.06 | $26.56 | $27.02 | $31.88 | $32.7 |
| P/E Ratio | 14.5 | 10.83 | 14.76 | 21.28 | 12.85 | 12.77 |
| Free Cash Flow (M) | $679 | $881 | $894 | $1,942 | $2,177 | $2,374 |
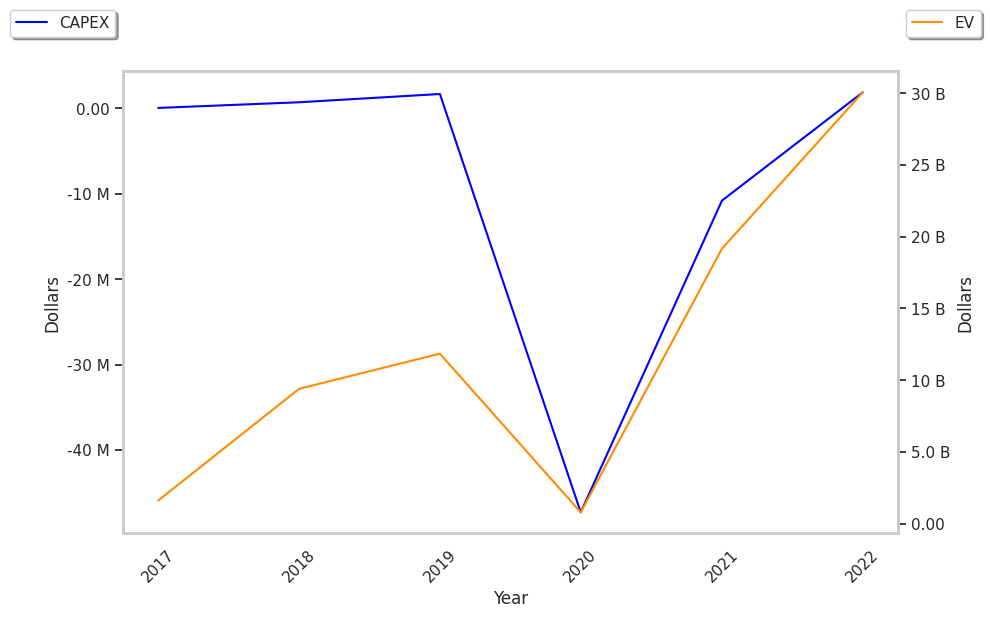
| CAPEX (M) | $3 | $3 | $3 | $2 | $4 | $8 |
| EV / EBITDA | 196.39 | 17.07 | 17.69 | 29.55 | 18.88 | 18.39 |
| Total Debt (M) | $4,792 | $6,766 | $4,695 | $13,740 | $16,724 | $16,733 |
| Net Debt / EBITDA | 65.73 | 7.16 | 3.84 | 11.84 | 6.35 | 5.93 |
VICI Properties has rapidly growing revenues and increasing reinvestment in the business and strong operating margins with a positive growth rate. Additionally, the company's financial statements display generally positive cash flows and a strong EPS growth trend. However, the firm has a highly leveraged balance sheet.
VICI Properties Is Potentially Undervalued and Trades Below Its Fair Value:
VICI Properties has a trailing twelve month P/E ratio of 12.7, compared to an average of 27.31 for the Real Estate sector. Based on its EPS guidance of $2.73, the company has a forward P/E ratio of 12.1. The 11.9% compound average growth rate of VICI Properties's historical and projected earnings per share yields a PEG ratio of 1.06. This implies that the shares are fairly valued. Additionally, the market is possibly undervaluing VICI Properties in terms of its equity because its P/B ratio is 1.28 whereas the sector average is 1.94. The company's shares are currently trading -14.5% above their Graham number.
VICI Properties Has an Average Rating of Buy:
The 22 analysts following VICI Properties have set target prices ranging from $34.0 to $44.0 per share, for an average of $36.82 with a buy rating. The company is trading -11.3% away from its average target price, indicating that there is an analyst consensus of some upside potential.
VICI Properties has an average amount of shares sold short because 2.8% of the company's shares are sold short. Institutions own 102.3% of the company's shares, and the insider ownership rate stands at 0.27%, suggesting a small amount of insider investors. The largest shareholder is Vanguard Group Inc, whose 15% stake in the company is worth $5,097,797,978.