Now trading at a price of $39.45, Chipotle Mexican Grill has moved 0.4% so far today.
Chipotle Mexican Grill returned losses of -31.0% last year, with its stock price reaching a high of $66.74 and a low of $38.3. Over the same period, the stock underperformed the S&P 500 index by -48.6%. AThe company's 50-day average price was $45.15. Chipotle Mexican Grill, Inc., together with its subsidiaries, owns and operates Chipotle Mexican Grill restaurants. Based in Newport Beach, CA, the Large-Cap Consumer Discretionary company has 130,000 full time employees. Chipotle Mexican Grill has not offered a dividend during the last year.
Strong Revenue Growth and a Decent Current Ratio:
| 2019 | 2020 | 2021 | 2022 | 2023 | 2024 | |
|---|---|---|---|---|---|---|
| Revenue (M) | $5,586 | $5,985 | $7,547 | $8,635 | $9,872 | $11,314 |
| Operating Margins | 8% | 5% | 11% | 13% | 16% | 17% |
| Net Margins | 6% | 6% | 9% | 10% | 12% | 14% |
| Net Income (M) | $350 | $356 | $653 | $899 | $1,229 | $1,534 |
| Net Interest Expense (M) | $14 | $4 | $8 | $21 | $63 | $94 |
| Depreciation & Amort. (M) | $213 | $239 | $255 | $287 | $319 | $335 |
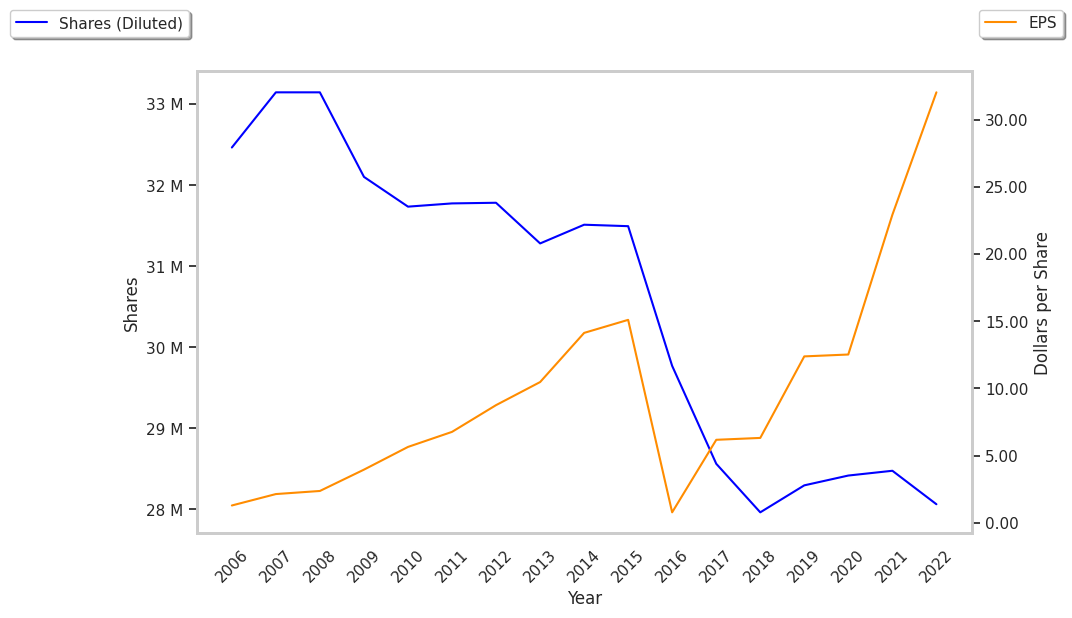
| Diluted Shares (M) | 1,415 | 1,421 | 1,426 | 1,403 | 1,386 | 1,377 |
| Earnings Per Share | $0.25 | $0.25 | $0.46 | $0.64 | $0.89 | $1.11 |
| EPS Growth | n/a | 0.0% | 84.0% | 39.13% | 39.06% | 24.72% |
| Avg. Price | $722.89 | $1060.86 | $1615.89 | $1445.2 | $2286.96 | $39.3 |
| P/E Ratio | 2891.56 | 4080.23 | 3512.8 | 2258.12 | 2569.62 | 35.09 |
| Free Cash Flow (M) | $388 | $290 | $840 | $844 | $1,223 | $1,511 |
| CAPEX (M) | $334 | $373 | $442 | $479 | $561 | $594 |
| Current Ratio | 1.61 | 1.73 | 1.58 | 1.28 | 1.57 | 1.52 |
Chipotle Mexican Grill benefits from rapidly growing revenues and increasing reinvestment in the business, strong operating margins with a positive growth rate, and exceptional EPS growth. The company's financial statements show generally positive cash flows and a decent current ratio of 1.52.
The Market May Be Overvaluing Chipotle Mexican Grill's Earnings and Assets:
Chipotle Mexican Grill has a trailing twelve month P/E ratio of 40.0, compared to an average of 20.93 for the Consumer Discretionary sector. Based on its EPS guidance of $1.31, the company has a forward P/E ratio of 34.5. According to the 26.7% compound average growth rate of Chipotle Mexican Grill's historical and projected earnings per share, the company's PEG ratio is 1.5. Taking the weighted average of the company's EPS CAGR and the broader market's 5-year projected EPS growth rate, we obtain a normalized growth rate of 15.8%. On this basis, the company's PEG ratio is 2.53. This suggests that these shares are overvalued. Furthermore, Chipotle Mexican Grill is likely overvalued compared to the book value of its equity, since its P/B ratio of 15.0 is higher than the sector average of 2.93. The company's shares are currently trading 384.7% below their Graham number. Overall, Chipotle Mexican Grill's lofty valuation in terms of earnings and assets is to some extent attenuated by its strong cash flow trend and reasonable levels of debt.
Chipotle Mexican Grill Has an Average Rating of Buy:
The 33 analysts following Chipotle Mexican Grill have set target prices ranging from $45.0 to $65.0 per share, for an average of $57.24 with a buy rating. The company is trading -31.1% away from its average target price, indicating that there is an analyst consensus of strong upside potential.
Chipotle Mexican Grill has a very low short interest because 1.8% of the company's shares are sold short. Institutions own 90.4% of the company's shares, and the insider ownership rate stands at 0.67%, suggesting a small amount of insider investors. The largest shareholder is Geode Capital Management, LLC, whose 0% stake in the company is worth $1,170,215,942.