We've been asking ourselves recently if the market has placed a fair valuation on DexCom. Let's dive into some of the fundamental values of this Large-Cap Health Care company to determine if there might be an opportunity here for value-minded investors.
DexCom's Valuation Is in Line With Its Sector Averages:
DexCom, Inc., a medical device company, focuses on the design, development, and commercialization of continuous glucose monitoring (CGM) systems in the United States and internationally. The company belongs to the Health Care sector, which has an average price to earnings (P/E) ratio of 22.94 and an average price to book (P/B) ratio of 3.19. In contrast, DexCom has a trailing 12 month P/E ratio of 53.5 and a P/B ratio of 11.58.
DexCom has moved 10.2% over the last year compared to 17.6% for the S&P 500 -- a difference of -7.4%. DexCom has a 52 week high of $93.25 and a 52 week low of $57.52.
Strong Revenue Growth but an Average Current Ratio:
| 2019 | 2020 | 2021 | 2022 | 2023 | 2024 | |
|---|---|---|---|---|---|---|
| Revenue (M) | $1,476 | $1,927 | $2,448 | $2,910 | $3,622 | $4,033 |
| Gross Margins | 63% | 66% | 69% | 65% | 63% | 60% |
| Net Margins | 7% | 28% | 9% | 12% | 15% | 14% |
| Net Income (M) | $101 | $550 | $217 | $341 | $542 | $576 |
| Net Interest Expense (M) | $60 | $18 | $19 | $19 | $20 | $15 |
| Depreciation & Amort. (M) | $49 | $67 | $102 | $156 | $186 | $181 |
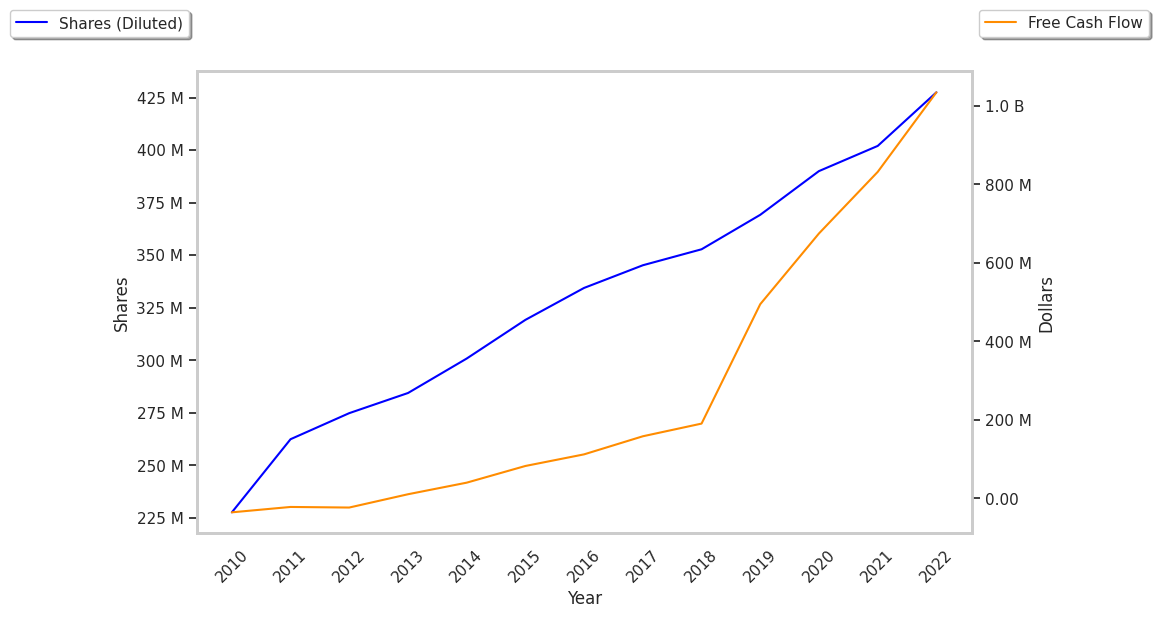
| Diluted Shares (M) | 369 | 420 | 429 | 428 | 426 | 413 |
| Earnings Per Share | $0.27 | $1.31 | $0.51 | $0.8 | $1.27 | $1.4 |
| EPS Growth | n/a | 385.19% | -61.07% | 56.86% | 58.75% | 10.24% |
| Avg. Price | $38.28 | $86.54 | $115.25 | $99.52 | $124.09 | $76.55 |
| P/E Ratio | 136.71 | 57.69 | 205.8 | 113.09 | 88.64 | 51.38 |
| Free Cash Flow (M) | $134 | $277 | $53 | $305 | $512 | $631 |
| CAPEX (M) | $180 | $199 | $389 | $365 | $237 | $359 |
| EV / EBITDA | 75.36 | 88.8 | 122.32 | 73.05 | 63.57 | 40.13 |
| Total Debt (M) | $1,060 | $1,667 | $1,703 | $1,970 | $2,434 | $2,441 |
| Net Debt / EBITDA | 3.21 | 2.32 | 1.77 | 2.43 | 2.38 | 2.35 |
| Current Ratio | 5.47 | 5.58 | 5.11 | 1.99 | 2.84 | 1.47 |
DexCom has rapidly growing revenues and increasing reinvestment in the business and exceptional EPS growth. Additionally, the company's financial statements display generally positive cash flows and healthy leverage levels. Furthermore, DexCom has similar gross margins to its peers and just enough current assets to cover current liabilities, as shown by its current ratio of 1.47.