It hasn't been a great afternoon session for Sea investors, who have watched their shares sink by -1.2% to a price of $186.87. Some of you might be wondering if it's time to buy the dip. If you are considering this, make sure to check the company's fundamentals first to determine if the shares are fairly valued at today's prices.
Sea's P/B and P/E Ratios Are Higher Than Average:
Sea Limited, through its subsidiaries, operates as a consumer internet company in Southeast Asia, Latin America, the rest of Asia, and internationally. The company belongs to the Consumer Discretionary sector, which has an average price to earnings (P/E) ratio of 20.93 and an average price to book (P/B) ratio of 2.93. In contrast, Sea has a trailing 12 month P/E ratio of 95.8 and a P/B ratio of 11.76.
Sea has moved 129.5% over the last year compared to 17.6% for the S&P 500 — a difference of 111.9%. Sea has a 52 week high of $199.3 and a 52 week low of $80.39.
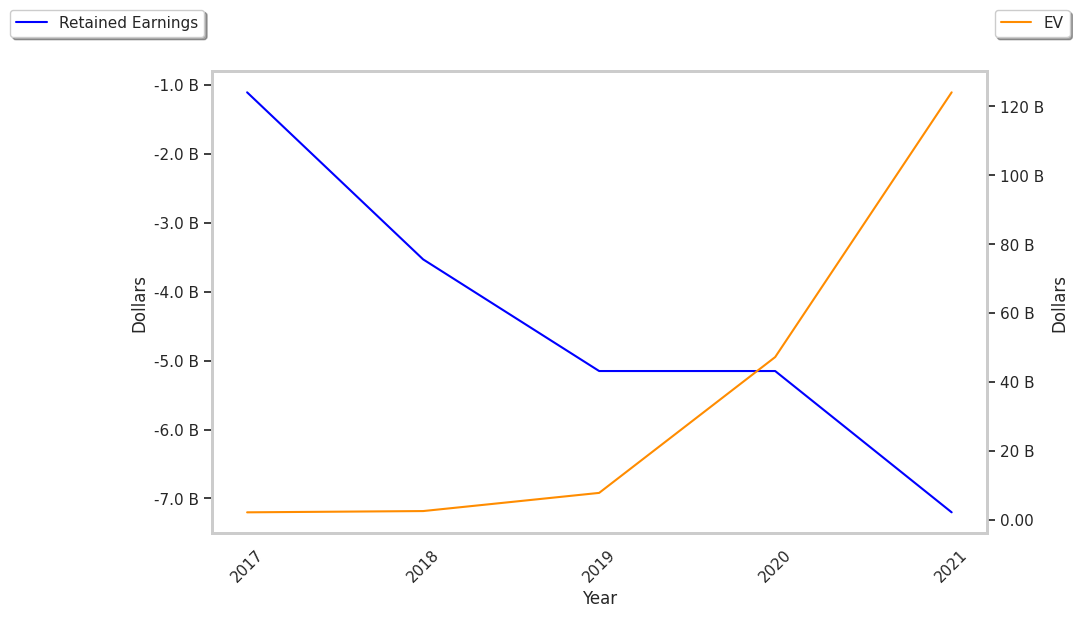
The Firm Has a Highly Leveraged Balance Sheet:
| 2019 | 2020 | 2021 | 2022 | 2023 | 2024 | |
|---|---|---|---|---|---|---|
| Revenue (M) | $2,175 | $4,376 | $9,955 | $12,450 | $13,064 | $16,820 |
| Gross Margins | 28% | 31% | 39% | 42% | 45% | 43% |
| Net Margins | -67% | -37% | -21% | -13% | 1% | 3% |
| Net Income (M) | -$1,463 | -$1,618 | -$2,047 | -$1,651 | $151 | $444 |
| Net Interest Expense (M) | $48 | $124 | $137 | $45 | $41 | $38 |
| Depreciation & Amort. (M) | $117 | $169 | $261 | $428 | $441 | $354 |
| Diluted Shares (M) | 437 | 477 | 533 | 558 | 594 | 605 |
| Earnings Per Share | -$3.35 | -$3.39 | -$3.84 | -$2.96 | $0.25 | $0.74 |
| EPS Growth | n/a | -1.19% | -13.27% | 22.92% | 108.45% | 196.0% |
| Avg. Price | $28.1 | $108.2 | $273.42 | $111.59 | $40.5 | $185.46 |
| P/E Ratio | -8.39 | -31.92 | -71.2 | -37.7 | 150.0 | 240.86 |
| Free Cash Flow (M) | -$170 | $220 | -$564 | -$1,980 | $1,838 | $2,959 |
| CAPEX (M) | $240 | $336 | $772 | $924 | $242 | $318 |
| EV / EBITDA | -14.57 | -45.38 | -112.19 | -59.03 | 39.39 | 112.15 |
| Total Debt (M) | $1,387 | $2,243 | $5,106 | $5,534 | $5,853 | $7,168 |
| Net Debt / EBITDA | 2.24 | 3.46 | 3.13 | 0.47 | 4.57 | 4.68 |
| Current Ratio | 1.87 | 1.93 | 2.11 | 1.83 | 1.44 | 1.49 |
Sea has rapidly growing revenues and a flat capital expenditure trend, generally positive cash flows, and positive EPS growth. However, the firm suffers from slimmer gross margins than its peers and a highly leveraged balance sheet. Finally, we note that Sea has just enough current assets to cover current liabilities, as shown by its current ratio of 1.49.