Now trading at a price of $97.36, Dollar Tree has moved -0.4% so far today.
Dollar Tree returned gains of 32.3% last year, with its stock price reaching a high of $118.06 and a low of $60.49. Over the same period, the stock outperformed the S&P 500 index by 16.8%. More recently, the company's 50-day average price was $109.55. Dollar Tree, Inc. operates retail discount stores under the Dollar Tree and Dollar Tree Canada brands in the United States and Canada. Based in Chesapeake, VA, the Large-Cap Consumer Discretionary company has 64,434 full time employees. Dollar Tree has not offered a dividend during the last year.
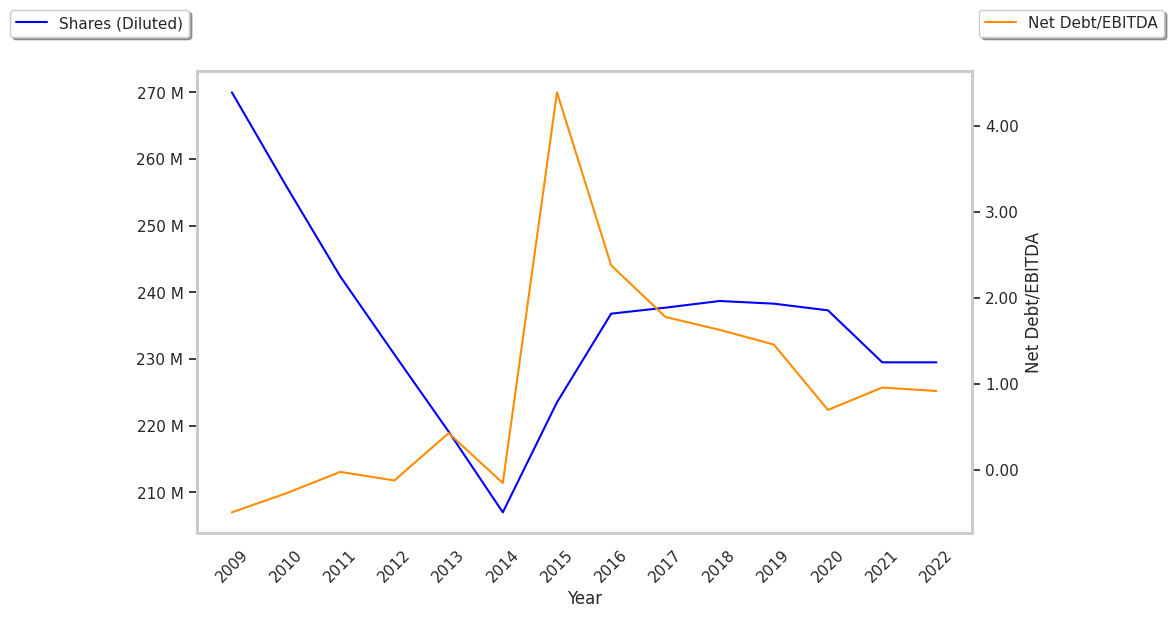
Healthy Leverage Levels but a Declining EPS Growth Trend:
| 2019 | 2020 | 2021 | 2022 | 2023 | 2024 | |
|---|---|---|---|---|---|---|
| Revenue (M) | $23,611 | $25,508 | $26,321 | $15,412 | $16,781 | $17,578 |
| Gross Margins | 30% | 31% | 28% | 37% | 36% | 36% |
| Net Margins | 4% | 5% | 5% | 10% | -6% | -17% |
| Net Income (M) | $827 | $1,342 | $1,328 | $1,615 | -$998 | -$3,030 |
| Net Interest Expense (M) | -$162 | -$147 | -$179 | -$127 | -$112 | -$108 |
| Depreciation & Amort. (M) | $494 | $687 | $716 | $365 | $400 | $525 |
| Diluted Shares (M) | 238 | 226 | 223 | 219 | 215 | 214 |
| Earnings Per Share | $3.47 | $5.65 | $5.8 | $7.21 | -$4.54 | -$14.03 |
| EPS Growth | n/a | 62.82% | 2.65% | 24.31% | -162.97% | -209.03% |
| Avg. Price | $103.29 | $90.84 | $108.45 | $150.52 | $142.05 | $97.78 |
| P/E Ratio | 29.6 | 15.99 | 18.6 | 20.79 | -31.22 | -6.96 |
| Free Cash Flow (M) | $835 | $1,818 | $410 | $976 | $1,491 | $388 |
| CAPEX (M) | $1,035 | $899 | $1,021 | $639 | $1,194 | $1,300 |
| EV / EBITDA | 17.3 | 10.47 | 10.84 | 14.72 | 15.49 | 11.81 |
| Total Debt (M) | $7,044 | $6,452 | $3,417 | $3,422 | $3,426 | $3,431 |
| Net Debt / EBITDA | 3.37 | 2.23 | 1.18 | 1.21 | 1.25 | 1.22 |
| Current Ratio | 1.28 | 1.25 | 1.38 | 1.36 | 1.03 | 1.04 |
Dollar Tree has declining revenues and increasing reinvestment in the business, similar gross margins to its peers, and just enough current assets to cover current liabilities, as shown by its current ratio of 1.04. We also note that the company has healthy leverage levels working in its favor. However, the firm suffers from declining EPS growth and positive cash flows.
Dollar Tree Is Fairly Priced to Earnings but Overpriced Compared to Its Book Value:
Dollar Tree has a trailing twelve month P/E ratio of 21.2, compared to an average of 20.93 for the Consumer Discretionary sector. Based on its EPS guidance of $6.06, the company has a forward P/E ratio of 18.1. The 8.3% compound average growth rate of Dollar Tree's historical and projected earnings per share yields a PEG ratio of 2.56. This suggests that these shares are overvalued. Furthermore, Dollar Tree is likely overvalued compared to the book value of its equity, since its P/B ratio of 5.53 is higher than the sector average of 2.93. Ultimately, Dollar Tree's strong cash flows, decent earnings multiple, and healthy debt levels factor towards it being fairly valued, its elevated P/B ratio notwithstanding.
Dollar Tree Has an Average Rating of Buy:
The 23 analysts following Dollar Tree have set target prices ranging from $75.0 to $140.0 per share, for an average of $112.3 with a buy rating. The company is trading -13.3% away from its average target price, indicating that there is an analyst consensus of some upside potential.
Dollar Tree has an above average percentage of its shares sold short because 9.2% of the company's shares are sold short. Institutions own 107.3% of the company's shares, and the insider ownership rate stands at 0.14%, suggesting a small amount of insider investors. The largest shareholder is Vanguard Group Inc, whose 12% stake in the company is worth $2,294,495,653.