Shares of Consumer Discretionary sector company Darden Restaurants moved -2.8% today, and are now trading at a price of $187.35. The Large-Cap stock's daily volume was 421,727 compared to its average volume of 1,266,912. The S&P 500 index returned a 0.0% performance.
Darden Restaurants, Inc., together with its subsidiaries, owns and operates full-service restaurants in the United States and Canada. The company is based in Orlando and has 197,924 full time employees. Its market capitalization is $21,843,554,304. Darden Restaurants currently offers its equity investors a dividend that yields 3.0% per year.
29 analysts are following Darden Restaurants and have set target prices ranging from $157.0 to $259.0 per share. On average, they have given the company a rating of buy. At today's prices, DRI is trading -16.81% away from its average analyst target price of $225.21 per share.
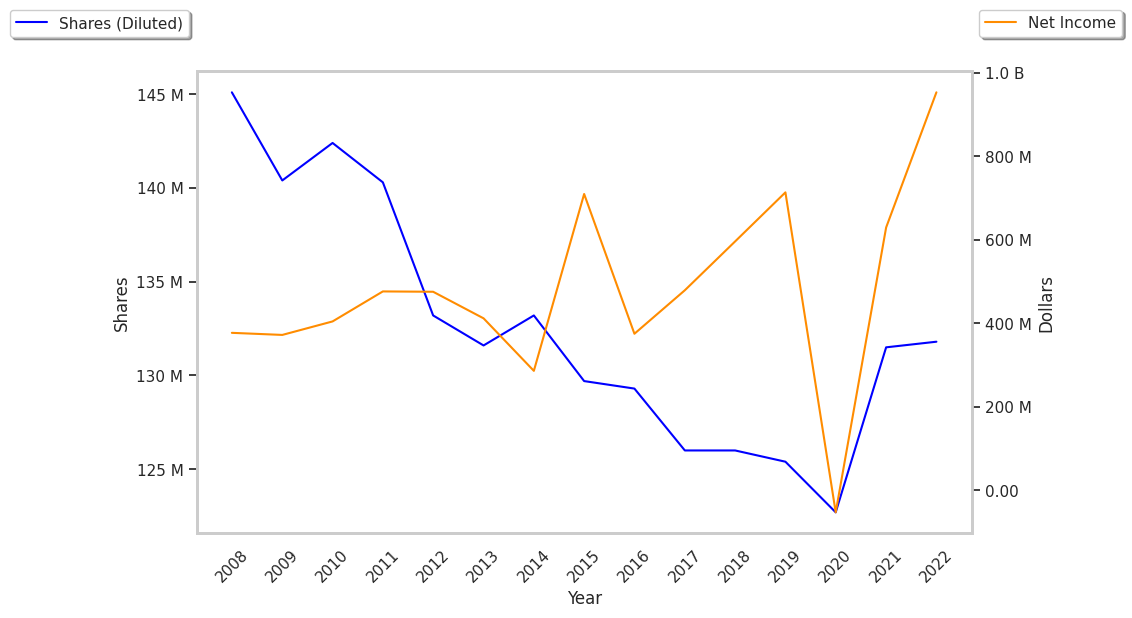
Over the last year, DRI's share price has increased by 13.3%, which represents a difference of -3.0% when compared to the S&P 500. The stock's 52 week high is $228.27 per share whereas its 52 week low is $155.18. With average free cash flows of $859.1 Million that have been growing at an average rate of 12.2% over the last 5 years, Darden Restaurants is in a position to continue its strong stock performance trend.
| Date Reported | Cash Flow from Operations ($ k) | Capital expenditures ($ k) | Free Cash Flow ($ k) | YoY Growth (%) |
|---|---|---|---|---|
| 2024 | 1,707,000 | 644,600 | 1,062,400 | 4.11 |
| 2023 | 1,621,700 | 601,200 | 1,020,500 | 3.3 |
| 2022 | 1,552,800 | 564,900 | 987,900 | 11.29 |
| 2021 | 1,264,600 | 376,900 | 887,700 | -5.42 |
| 2020 | 1,193,500 | 254,900 | 938,600 | 264.5 |
| 2019 | 717,400 | 459,900 | 257,500 |