We've been asking ourselves recently if the market has placed a fair valuation on Stellantis. Let's dive into some of the fundamental values of this Large-Cap Industrials company to determine if there might be an opportunity here for value-minded investors.
Stellantis Is Reasonably Valued:
Stellantis N.V. engages in the design, engineering, manufacturing, distribution, and sale of automobiles and light commercial vehicles, engines, transmission systems, metallurgical products, mobility services, and production systems worldwide. The company belongs to the Industrials sector, which has an average price to earnings (P/E) ratio of 24.03 and an average price to book (P/B) ratio of 2.89. In contrast, Stellantis has a trailing 12 month P/E ratio of -10.4 and a P/B ratio of 0.39.
Stellantis has moved -36.1% over the last year compared to 16.5% for the S&P 500 -- a difference of -52.6%. Stellantis has a 52 week high of $16.29 and a 52 week low of $8.39.
A Flat EPS Growth Trend and Positive Cash Flows:
| 2019 | 2020 | 2021 | 2022 | 2023 | 2024 | |
|---|---|---|---|---|---|---|
| Revenue (M) | $58,993 | $47,656 | $149,419 | $179,592 | $189,544 | $156,878 |
| Operating Margins | 6% | 6% | 11% | 11% | 12% | 2% |
| Net Margins | 6% | 4% | 10% | 9% | 10% | 4% |
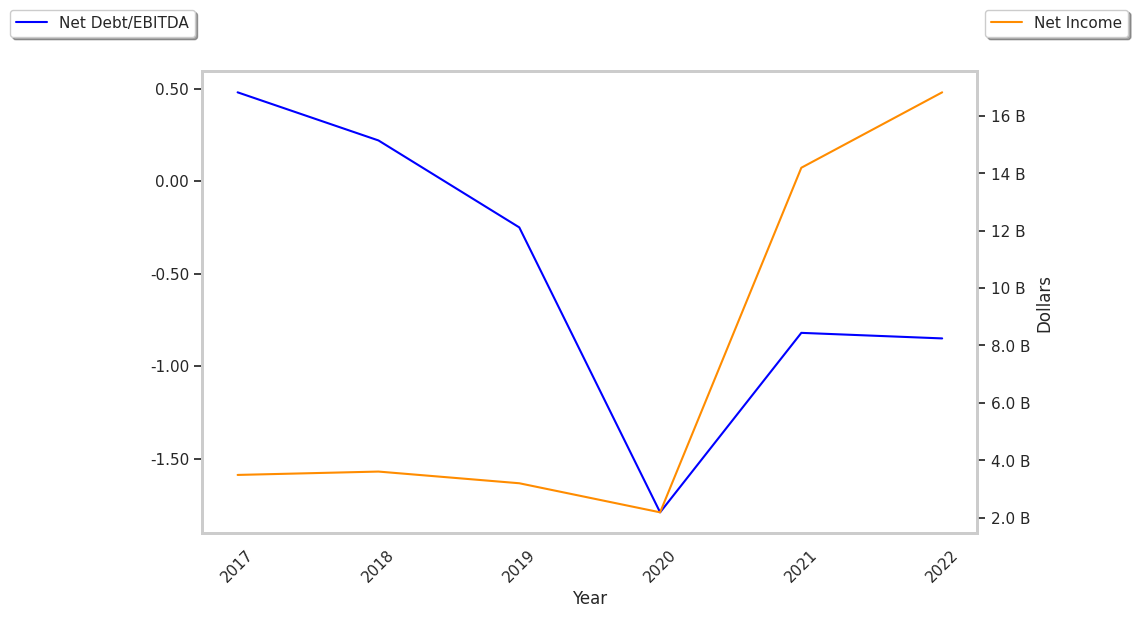
| Net Income (M) | $3,584 | $2,023 | $14,208 | $16,779 | $18,625 | $5,520 |
| Net Interest Expense (M) | $140 | $178 | $545 | $959 | $1,064 | $1,248 |
| Diluted Shares (M) | 1,568 | 1,575 | 3,133 | 3,133 | 3,023 | 2,880 |
| Earnings Per Share | $1.95 | $1.34 | $4.51 | $5.31 | $5.94 | $1.84 |
| EPS Growth | n/a | -31.28% | 236.57% | 17.74% | 11.86% | -69.02% |
| Avg. Price | $9.06 | $8.22 | $15.76 | $14.07 | $23.32 | $9.88 |
| P/E Ratio | 4.42 | 5.83 | 3.4 | 2.63 | 3.9 | 5.31 |
| Free Cash Flow (M) | $8,667 | $12,273 | $18,646 | $19,959 | $22,485 | $4,008 |
| Total Debt (M) | $8,025 | $11,068 | $22,624 | $19,469 | $20,001 | $25,028 |
| Current Ratio | 0.81 | 1.19 | 1.15 | 1.27 | 1.24 | 1.09 |