Oil and Gas Field Machinery company Baker Hughes is standing out today, surging to $49.19 and marking a 3.2% change. In comparison the S&P 500 moved only -1.0%.
BKR currently sits within range of its analyst target price of $51.05, which implies that its price may remain stable for the near future.
Surprisingly, analysts give the stock an average rating of buy, which shows that they believe prices could continue to move. Over the last year, Baker Hughes shares have outperformed the S&P 500 by 14.4%, with a price change of 31.2%.
Baker Hughes Company provides a portfolio of technologies and services to energy and industrial value chain worldwide. The company is a consumer cyclical company, whose sales figures depend on discretionary income levels in its consumer base. For this reason, consumer cyclical companies have better sales and stock performance during periods of economic growth, when consumers have more of an incentive to spend their money on non-essential items.
Baker Hughes's trailing 12 month P/E ratio is 16.1, based on its trailing EPS of $3.06. The company has a forward P/E ratio of 18.7 according to its forward EPS of $2.57 -- which is an estimate of what its earnings will look like in the next quarter.
As of the third quarter of 2024, the average Price to Earnings (P/E) ratio for US consumer discretionary companies is 20.93, and the S&P 500 has an average of 29.3. The P/E ratio consists in the stock's share price divided by its earnings per share (EPS), representing how much investors are willing to spend for each dollar of the company's earnings. Earnings are the company's revenues minus the cost of goods sold, overhead, and taxes.
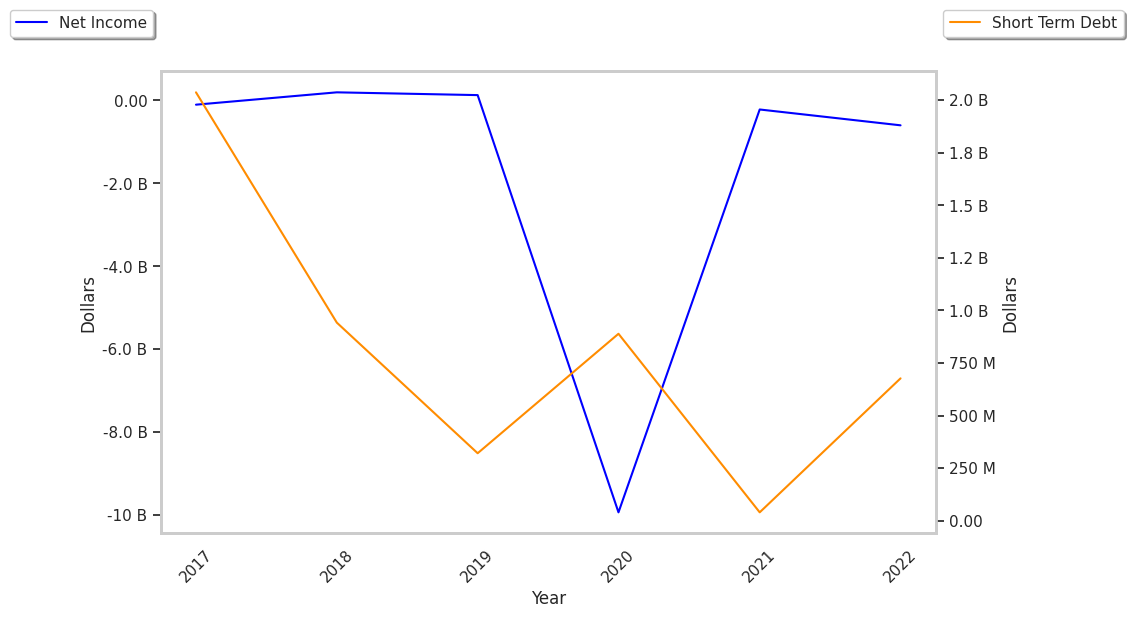
Another key to assessing a company's health is to look at its free cash flow, which is calculated on the basis of its total cash flow from operating activities minus its capital expenditures. Capital expenditures are the costs of maintaining fixed assets such as land, buildings, and equipment. From Baker Hughes's last four annual reports, we are able to obtain the following rundown of its free cash flow:
| Date Reported | Cash Flow from Operations ($ k) | Capital expenditures ($ k) | Free Cash Flow ($ k) | YoY Growth (%) |
|---|---|---|---|---|
| 2024 | 3,332,000 | 1,278,000 | 2,054,000 | 11.75 |
| 2023 | 3,062,000 | 1,224,000 | 1,838,000 | 104.45 |
| 2022 | 1,888,000 | 989,000 | 899,000 | -40.78 |
| 2021 | 2,374,000 | 856,000 | 1,518,000 | 360.0 |
| 2020 | 1,304,000 | 974,000 | 330,000 | -62.75 |
| 2019 | 2,126,000 | 1,240,000 | 886,000 |
- Average free cash flow: $1.25 Billion
- Average free cash flown growth rate: 18.3 %
- Coefficient of variability (the lower the better): 0.0 %
With its positive cash flow, the company can not only re-invest in its business, it can offer regular returns to its equity investors in the form of dividends. Over the last 12 months, investors in BKR have received an annualized dividend yield of 1.8% on their capital.
Value investors often analyze stocks through the lens of its Price to Book (P/B) Ratio (market value divided by book value). The book value refers to the present value of the company if the company were to sell off all of its assets and pay all of its debts today - a number whose value may differ significantly depending on the accounting method.
Baker Hughes has a P/B ratio of 2.74. This indicates that the market value of the company exceeds its book value by a factor of more than 2, but is still below the average P/B ratio of the Consumer Discretionary sector, which stood at 2.93 as of the third quarter of 2024.
Baker Hughes is by most measures undervalued because it has a Very low P/E ratio, an average P/B ratio, and generally positive cash flows with an upwards trend. The stock has mixed growth prospects because it has a a PEG ratio of less than 1 and weak operating margins with a positive growth rate. We hope you enjoyed this overview of BKR's fundamentals.