We've been asking ourselves recently if the market has placed a fair valuation on Cboe Global Markets. Let's dive into some of the fundamental values of this Large-Cap Finance company to determine if there might be an opportunity here for value-minded investors.
Cboe Global Markets's P/B and P/E Ratios Are Higher Than Average:
Cboe Global Markets, Inc., through its subsidiaries, operates as an options exchange in the United States and internationally. The company belongs to the Finance sector, which has an average price to earnings (P/E) ratio of 15.92 and an average price to book (P/B) ratio of 1.78. In contrast, Cboe Global Markets has a trailing 12 month P/E ratio of 28.1 and a P/B ratio of 5.38.
Cboe Global Markets has moved 18.3% over the last year compared to 16.3% for the S&P 500 -- a difference of 2.0%. Cboe Global Markets has a 52 week high of $255.27 and a 52 week low of $187.3.
Growing Revenues and a Decent Current Ratio:
| 2019 | 2020 | 2021 | 2022 | 2023 | 2024 | |
|---|---|---|---|---|---|---|
| Revenue (M) | $2,496 | $3,427 | $3,495 | $3,958 | $3,774 | $4,094 |
| Interest Income (M) | -$36 | -$38 | -$47 | -$56 | -$50 | -$24 |
| Operating Margins | 22% | 19% | 23% | 12% | 28% | 27% |
| Net Margins | 15% | 14% | 15% | 6% | 20% | 19% |
| Net Income (M) | $375 | $468 | $529 | $235 | $761 | $765 |
| Depreciation & Amort. (M) | $24 | $27 | $34 | $35 | $33 | $34 |
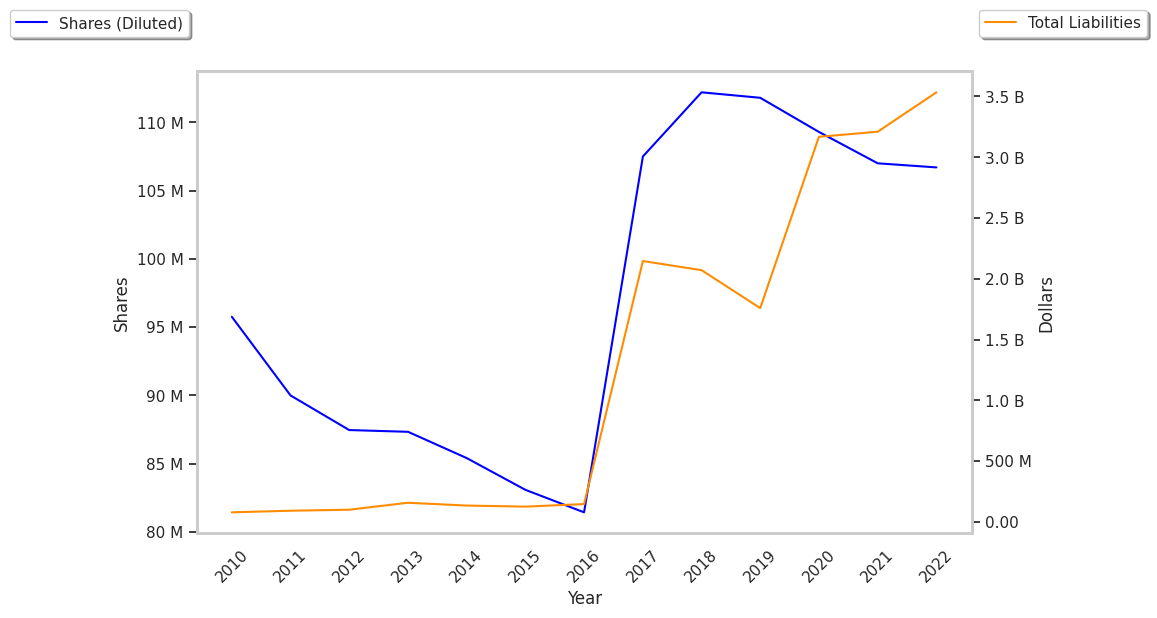
| Diluted Shares (M) | 112 | 109 | 107 | 107 | 106 | 106 |
| Earnings Per Share | $3.34 | $4.27 | $4.92 | $2.19 | $7.13 | $7.21 |
| EPS Growth | n/a | 27.84% | 15.22% | -55.49% | 225.57% | 1.12% |
| Avg. Price | $101.58 | $92.2 | $111.24 | $113.09 | $178.56 | $240.32 |
| P/E Ratio | 30.32 | 21.54 | 22.56 | 51.4 | 24.94 | 33.19 |
| Free Cash Flow (M) | $598 | $1,411 | $546 | $591 | $1,031 | $1,040 |
| CAPEX (M) | $35 | $47 | $51 | $60 | $45 | $61 |
| EV / EBITDA | 21.32 | 16.27 | 15.35 | 26.04 | 18.13 | 22.87 |
| Total Debt (M) | $868 | $1,273 | $1,299 | $2,047 | $1,439 | $1,441 |
| Net Debt / EBITDA | 1.14 | 1.49 | 1.14 | 3.07 | 0.82 | 0.46 |
| Current Ratio | 2.16 | 1.19 | 1.31 | 1.05 | 1.43 | 1.78 |
Cboe Global Markets has growing revenues and increasing reinvestment in the business, strong operating margins with a positive growth rate, and low leverage levels. The company also benefits from a strong EPS growth trend, generally positive cash flows, and a decent current ratio of 1.78.