Now trading at a price of $191.6, Molina Healthcare Inc has moved 5.0% so far today.
Molina Healthcare Inc returned losses of -47.0% last year, with its stock price reaching a high of $359.97 and a low of $151.95. Over the same period, the stock underperformed the S&P 500 index by -63.3%. AThe company's 50-day average price was $173.38. Molina Healthcare, Inc. provides managed healthcare services to low-income families and individuals under the Medicaid and Medicare programs and through the state insurance marketplaces. Based in Long Beach, CA, the Large-Cap Health Care company has 18,000 full time employees. Molina Healthcare Inc has not offered a dividend during the last year.
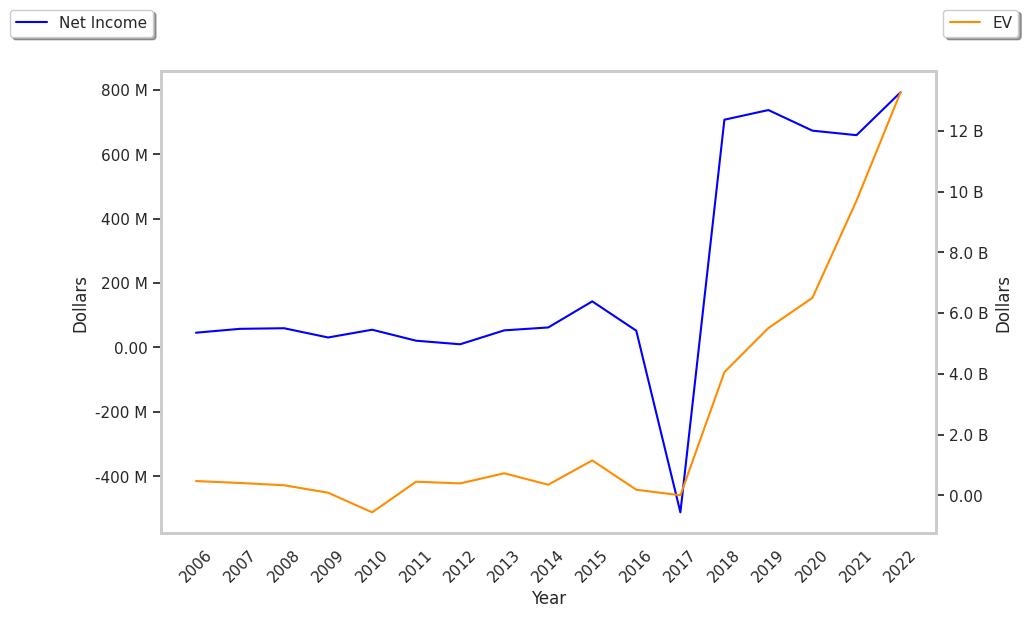
Increasing Revenues but Narrowing Margins:
| 2019 | 2020 | 2021 | 2022 | 2023 | 2024 | |
|---|---|---|---|---|---|---|
| Revenue (M) | $16,829 | $19,423 | $27,771 | $31,974 | $34,072 | $40,650 |
| Operating Margins | 6% | 6% | 4% | 4% | 5% | 4% |
| Net Margins | 4% | 3% | 2% | 2% | 3% | 3% |
| Net Income (M) | $737 | $673 | $659 | $792 | $1,091 | $1,179 |
| Net Interest Expense (M) | $87 | $102 | $120 | $110 | $109 | $121 |
| Depreciation & Amort. (M) | $89 | $88 | $131 | $176 | $171 | $16 |
| Diluted Shares (M) | 64 | 60 | 59 | 58 | 58 | 58 |
| Earnings Per Share | $11.47 | $11.23 | $11.25 | $13.55 | $18.77 | $20.42 |
| EPS Growth | n/a | -2.09% | 0.18% | 20.44% | 38.52% | 8.79% |
| Avg. Price | $131.87 | $173.45 | $259.39 | $304.04 | $361.31 | $192.27 |
| P/E Ratio | 11.13 | 15.21 | 22.75 | 22.16 | 19.11 | 9.37 |
| Free Cash Flow (M) | $377 | $1,824 | $2,042 | $682 | $1,578 | $544 |
| CAPEX (M) | $57 | $74 | $77 | $91 | $84 | $100 |
| EV / EBITDA | 6.21 | 7.31 | 11.1 | 11.81 | 10.47 | 5.51 |
| Total Debt (M) | $1,255 | $2,127 | $2,173 | $2,176 | $2,180 | $2,923 |
| Net Debt / EBITDA | -1.06 | -1.74 | -1.97 | -1.36 | -1.53 | -1.01 |
| Current Ratio | 1.83 | 1.59 | 1.43 | 1.47 | 1.54 | 1.62 |
Molina Healthcare Inc has rapidly growing revenues and increasing reinvestment in the business and a strong EPS growth trend. Additionally, the company's financial statements display a decent current ratio of 1.62 and healthy leverage levels. However, the firm has positive cash flows. Finally, we note that Molina Healthcare Inc has decent operating margins with a negative growth trend.
The Market May Be Undervaluing Molina Healthcare Inc's Assets and Equity:
Molina Healthcare Inc has a trailing twelve month P/E ratio of 8.5, compared to an average of 22.94 for the Health Care sector. Based on its EPS guidance of $25.71, the company has a forward P/E ratio of 6.7. The 12.2% compound average growth rate of Molina Healthcare Inc's historical and projected earnings per share yields a PEG ratio of 0.7. This suggests that its shares are undervalued. Additionally, the market is possibly undervaluing Molina Healthcare Inc in terms of its equity because its P/B ratio is 2.25 whereas the sector average is 3.19. The company's shares are currently trading 1.3% below their Graham number.
Molina Healthcare Inc Has No Average Rating:
Molina Healthcare Inc has an average amount of shares sold short because 7.1% of the company's shares are sold short. Institutions own 99.9% of the company's shares, and the insider ownership rate stands at 1.3%, suggesting a large amount of insider shareholders. The largest shareholder is Vanguard Group Inc, whose 12% stake in the company is worth $1,232,685,271.