Tapestry logged a -0.6% change during today's morning session, and is now trading at a price of $115.44 per share.
Tapestry returned gains of 154.0% last year, with its stock price reaching a high of $117.0 and a low of $43.07. Over the same period, the stock outperformed the S&P 500 index by 137.6%. More recently, the company's 50-day average price was $106.02. Tapestry, Inc. provides accessories and lifestyle brand products in North America, Greater China, rest of Asia, and internationally. Based in New York, NY, the Large-Cap Consumer Discretionary company has 12,500 full time employees. Tapestry has offered a 1.2% dividend yield over the last 12 months.
Wider Gross Margins Than the Industry Average of 54.69%:
| 2019 | 2020 | 2021 | 2022 | 2023 | 2024 | |
|---|---|---|---|---|---|---|
| Revenue (M) | $6,027 | $4,961 | $5,746 | $6,684 | $6,661 | $6,671 |
| Gross Margins | 67% | 65% | 71% | 70% | 71% | 73% |
| Net Margins | 11% | -13% | 15% | 13% | 14% | 12% |
| Net Income (M) | $643 | -$652 | $834 | $856 | $936 | $816 |
| Net Interest Expense (M) | -$48 | -$60 | -$71 | -$59 | -$28 | -$125 |
| Depreciation & Amort. (M) | $270 | $829 | $220 | $195 | $182 | $174 |
| Diluted Shares (M) | 277 | 281 | 285 | 243 | 232 | 225 |
| Earnings Per Share | $2.21 | -$2.34 | $2.95 | $3.17 | $3.88 | $3.5 |
| EPS Growth | n/a | -205.88% | 226.07% | 7.46% | 22.4% | -9.79% |
| Avg. Price | $26.73 | $18.27 | $39.2 | $34.01 | $36.81 | $116.14 |
| P/E Ratio | 12.04 | -7.81 | 13.07 | 10.5 | 9.3 | 32.62 |
| Free Cash Flow (M) | $518 | $202 | $1,208 | $759 | $791 | $1,147 |
| CAPEX (M) | $274 | $205 | $116 | $94 | $184 | $109 |
| EV / EBITDA | 7.68 | 20.49 | 9.17 | 6.6 | 6.85 | 21.64 |
| Total Debt (M) | $1,599 | $2,301 | $1,191 | $1,679 | $7,739 | $2,681 |
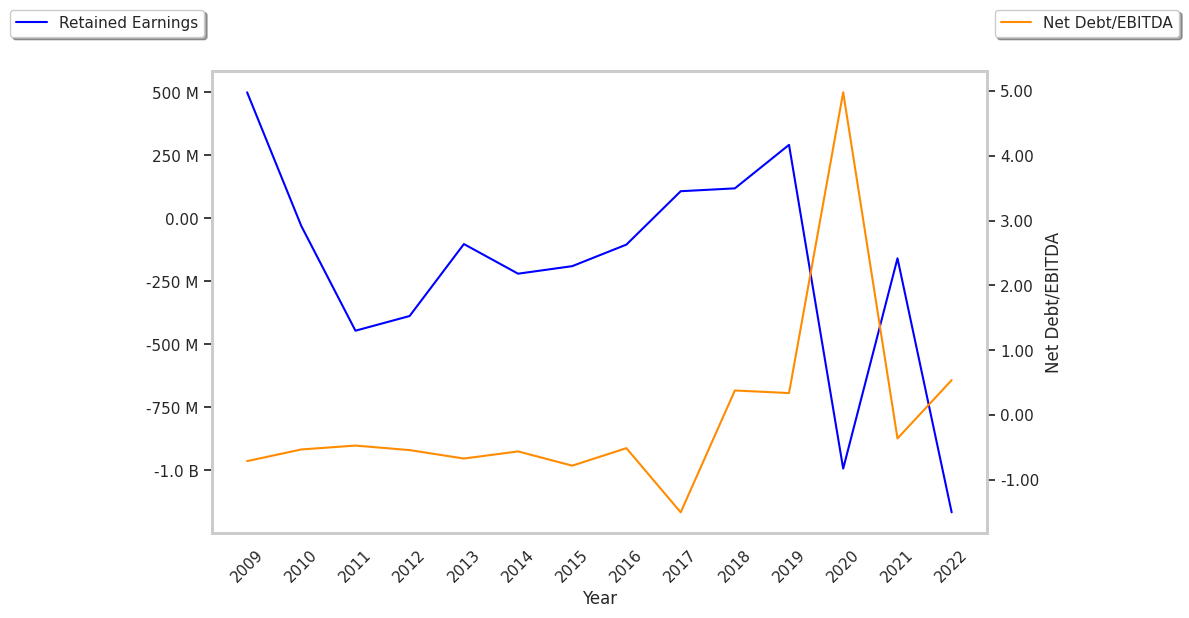
| Net Debt / EBITDA | 0.64 | 2.36 | -0.05 | 0.62 | 0.67 | 1.29 |
| Current Ratio | 2.01 | 1.88 | 1.87 | 1.87 | 6.25 | 1.58 |
Tapestry benefits from generally positive cash flows, wider gross margins than its peer group, and positive EPS growth. The company's financial statements show a decent current ratio of 1.58 and healthy leverage levels. Furthermore, Tapestry has growing revenues and decreasing reinvestment in the business.
Tapestry's Valuation Is in Line With Its Sector Averages:
Tapestry has a trailing twelve month P/E ratio of 129.3, compared to an average of 20.93 for the Consumer Discretionary sector. Based on its EPS guidance of $4.76, the company has a forward P/E ratio of 22.3. The 11.6% compound average growth rate of Tapestry's historical and projected earnings per share yields a PEG ratio of 11.16. This suggests that these shares are overvalued. Furthermore, Tapestry is likely overvalued compared to the book value of its equity, since its P/B ratio of 28.01 is higher than the sector average of 2.93. The company's shares are currently trading 433.7% below their Graham number. Ultimately, Tapestry's strong cash flows, decent earnings multiple, and healthy debt levels factor towards it being fairly valued, its elevated P/B ratio notwithstanding.
Tapestry Has an Analyst Consensus of Some Upside Potential:
The 18 analysts following Tapestry have set target prices ranging from $66.0 to $142.0 per share, for an average of $117.22 with a buy rating. The company is trading -1.5% away from its average target price, indicating that there is an analyst consensus of some upside potential.
Tapestry has an average amount of shares sold short because 6.7% of the company's shares are sold short. Institutions own 99.2% of the company's shares, and the insider ownership rate stands at 0.44%, suggesting a small amount of insider investors. The largest shareholder is Vanguard Group Inc, whose 12% stake in the company is worth $2,990,363,745.