One of Wall Street's biggest winners of the day is Guardant Health, a medical specialities company whose shares have climbed 9.1% to a price of $62.9 -- near its average analyst target price of $66.0.
The average analyst rating for the stock is buy. GH outperformed the S&P 500 index by 10.0% during today's morning session, and by 138.2% over the last year with a return of 153.7%.
Guardant Health, Inc., a precision oncology company, provides blood and tissue tests, and data sets in the United States and internationally. The company is categorized within the healthcare sector. The catalysts that drive valuations in this sector are complex. From demographics, regulations, scientific breakthroughs, to the emergence of new diseases, healthcare companies see their prices swing on the basis of a variety of factors.
Guardant Health does not publish either its forward or trailing P/E ratios because their values are negative -- meaning that each share of stock represents a net earnings loss. But we can calculate these P/E ratios anyways using the stocks forward and trailing (EPS) values of $-2.71 and $-3.35. We can see that GH has a forward P/E ratio of -23.2 and a trailing P/E ratio of -18.8.
As of the third quarter of 2024, the average Price to Earnings (P/E) ratio for US health care companies is 22.94, and the S&P 500 has an average of 29.3. The P/E ratio consists in the stock's share price divided by its earnings per share (EPS), representing how much investors are willing to spend for each dollar of the company's earnings. Earnings are the company's revenues minus the cost of goods sold, overhead, and taxes.
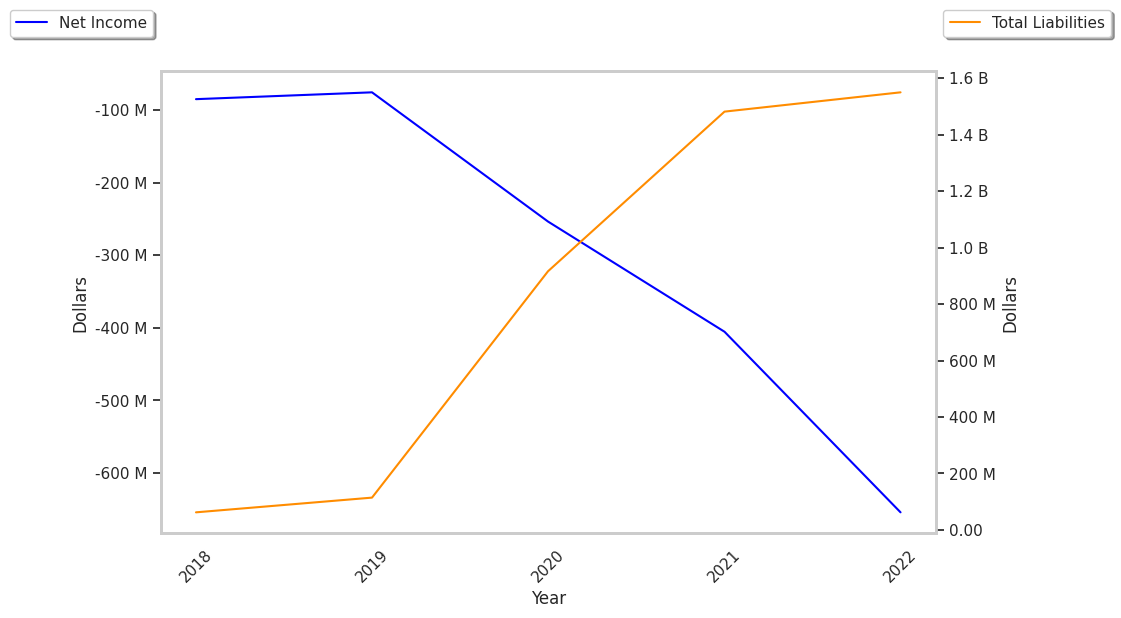
Guardant Health's financial viability can also be assessed through a review of its free cash flow trends. Free cash flow refers to the company's operating cash flows minus its capital expenditures, which are expenses related to the maintenance of fixed assets such as land, infrastructure, and equipment. Over the last four years, the trends have been as follows:
| Date Reported | Cash Flow from Operations ($ k) | Capital expenditures ($ k) | Free Cash Flow ($ k) | YoY Growth (%) |
|---|---|---|---|---|
| 2024 | -239,858 | 35,085 | -274,943 | 20.41 |
| 2023 | -324,975 | 20,486 | -345,461 | 10.72 |
| 2022 | -309,463 | 77,461 | -386,924 | -36.22 |
| 2021 | -209,017 | 75,035 | -284,052 | -102.75 |
| 2020 | -103,927 | 36,173 | -140,100 | -112.75 |
| 2019 | -47,134 | 18,717 | -65,851 |
- Average free cash flow: $-249555166.7
- Average free cash flown growth rate: -33.1 %
- Coefficient of variability (lower numbers indicating more stability): 0.0 %
If it weren't negative, the free cash flow would represent the amount of money available for reinvestment in the business, or for payments to equity investors in the form of a dividend. While a negative cash flow for one or two quarters is not a sign of financial troubles for GH, a long term trend of negative or highly erratic cash flow levels may indicate a struggling business or a mismanaged company.
Guardant Health is by most measures overvalued because it has a negative P/E ratio., no published P/B ratio, and negative cash flows with a downwards trend. The stock has poor growth indicators because it has a a negative PEG ratio and with a negative growth trend. We hope you enjoyed this overview of GH's fundamentals.