Now trading at a price of $275.88, Charter Communications has moved 2.0% so far today.
Charter Communications returned losses of -17.1% last year, with its stock price reaching a high of $437.06 and a low of $251.8. Over the same period, the stock underperformed the S&P 500 index by -32.2%. AThe company's 50-day average price was $281.77. Charter Communications, Inc. operates as a broadband connectivity and cable operator company serving residential and commercial customers in the United States. Based in Stamford, CT, the Large-Cap Telecommunications company has 94,500 full time employees. Charter Communications has not offered a dividend during the last year.
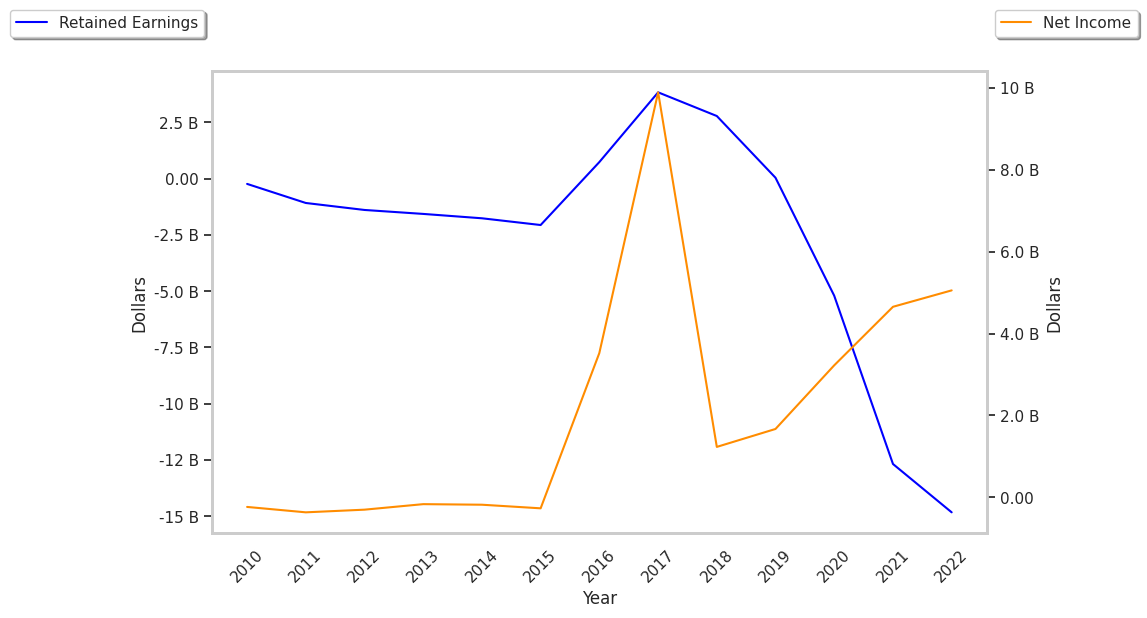
Exceptional Profitability Overshadowed by Excessive Leverage:
| 2019 | 2020 | 2021 | 2022 | 2023 | 2024 | |
|---|---|---|---|---|---|---|
| Revenue (M) | $45,764 | $48,097 | $51,682 | $54,022 | $54,607 | $55,085 |
| Operating Margins | 14% | 17% | 20% | 22% | 23% | 24% |
| Net Margins | 4% | 7% | 9% | 9% | 8% | 9% |
| Net Income (M) | $1,668 | $3,222 | $4,654 | $5,055 | $4,557 | $5,083 |
| Net Interest Expense (M) | -$3,797 | -$3,848 | -$4,037 | -$4,556 | -$5,188 | -$5,229 |
| Depreciation & Amort. (M) | $9,926 | $9,704 | $9,345 | $8,903 | $8,696 | $7,800 |
| Diluted Shares (M) | 218 | 212 | 193 | 164 | 152 | 145 |
| Earnings Per Share | $7.45 | $15.4 | $24.47 | $30.74 | $29.99 | $34.97 |
| EPS Growth | n/a | 106.71% | 58.9% | 25.62% | -2.44% | 16.61% |
| Avg. Price | $392.79 | $556.45 | $685.17 | $534.78 | $388.68 | $270.57 |
| P/E Ratio | 51.68 | 35.11 | 27.04 | 17.09 | 12.73 | 7.62 |
| Free Cash Flow (M) | $4,553 | $7,147 | $8,604 | $5,549 | $3,318 | $3,161 |
| CAPEX (M) | $7,195 | $7,415 | $7,635 | $9,376 | $11,115 | $11,269 |
| EV / EBITDA | 9.83 | 10.52 | 10.68 | 8.63 | 7.32 | 6.39 |
| Total Debt (M) | $82,578 | $83,760 | $94,558 | $99,113 | $99,777 | $95,732 |
| Net Debt / EBITDA | 4.81 | 4.57 | 4.73 | 4.72 | 4.66 | 4.55 |
| Current Ratio | 0.52 | 0.4 | 0.29 | 0.33 | 0.31 | 0.31 |
Charter Communications has growing revenues and increasing reinvestment in the business, strong operating margins with a positive growth rate, and exceptional EPS growth. However, Charter Communications has positive cash flows, not enough current assets to cover current liabilities because its current ratio is 0.31, and a highly leveraged balance sheet.
Charter Communications Shares Are Expensive:
Charter Communications has a trailing twelve month P/E ratio of 7.7, compared to an average of 18.22 for the Telecommunications sector. Based on its EPS guidance of $35.78, the company has a forward P/E ratio of 7.9. According to the 25.1% compound average growth rate of Charter Communications's historical and projected earnings per share, the company's PEG ratio is 0.31. Taking the weighted average of the company's EPS CAGR and the broader market's 5-year projected EPS growth rate, we obtain a normalized growth rate of 15.3%. On this basis, the company's PEG ratio is 0.5. This suggests that its shares are undervalued. In contrast, Charter Communications is likely overvalued compared to the book value of its equity, since its P/B ratio of 2.32 is higher than the sector average of 1.86. The company's shares are currently trading -5.0% above their Graham number.
Analysts Give Charter Communications an Average Rating of Buy:
The 20 analysts following Charter Communications have set target prices ranging from $223.0 to $500.0 per share, for an average of $387.6 with a buy rating. The company is trading -28.8% away from its average target price, indicating that there is an analyst consensus of strong upside potential.
Charter Communications has an unusually large proportion of its shares sold short because 19.6% of the company's shares are sold short. Institutions own 77.5% of the company's shares, and the insider ownership rate stands at 35.7%, suggesting a large amount of insider shareholders. The largest shareholder is Dodge & Cox Inc, whose 8% stake in the company is worth $3,069,575,012.