Now trading at a price of $67.6, Corteva has moved 0.8% so far today.
Corteva returned gains of 14.5% last year, with its stock price reaching a high of $77.41 and a low of $53.4. Over the same period, the stock returned a similar cumulative performance to the S&P 500. The company's 50-day average price was $72.19.
Corteva, Inc. operates in the agriculture business. Based in Indianapolis, IN, the Large-Cap Consumer Staples company has 22,000 full time employees. Corteva has offered a 1.0% dividend yield over the last 12 months.
Generally Positive Cash Flows but an Average Current Ratio:
| 2019 | 2020 | 2021 | 2022 | 2023 | 2024 | |
|---|---|---|---|---|---|---|
| Revenue (M) | $13,846 | $14,217 | $15,655 | $17,455 | $17,226 | $16,908 |
| Operating Margins | -2% | 5% | 15% | 8% | 6% | 8% |
| Net Margins | -7% | 5% | 11% | 7% | 4% | 5% |
| Net Income (M) | -$959 | $681 | $1,759 | $1,147 | $735 | $907 |
| Net Interest Expense (M) | $136 | $45 | $30 | $79 | $233 | $233 |
| Depreciation & Amort. (M) | $475 | $682 | $722 | $702 | $683 | $542 |
| Diluted Shares (M) | 750 | 751 | 742 | 724 | 712 | 696 |
| Earnings Per Share | -$1.28 | $0.91 | $2.37 | $1.58 | $1.03 | $1.3 |
| EPS Growth | n/a | 171.09% | 160.44% | -33.33% | -34.81% | 26.21% |
| Avg. Price | $26.24 | $28.37 | $43.88 | $53.84 | $47.92 | $67.08 |
| P/E Ratio | -20.5 | 31.18 | 18.36 | 33.86 | 46.08 | 51.21 |
| Free Cash Flow (M) | -$93 | $1,589 | $2,154 | $267 | $1,174 | $1,548 |
| CAPEX (M) | $1,163 | $475 | $573 | $605 | $595 | $597 |
| EV / EBITDA | 113.36 | 13.88 | 9.55 | 17.51 | 19.15 | 25.69 |
| Total Debt (M) | $122 | $1,105 | $1,117 | $1,307 | $2,489 | $2,703 |
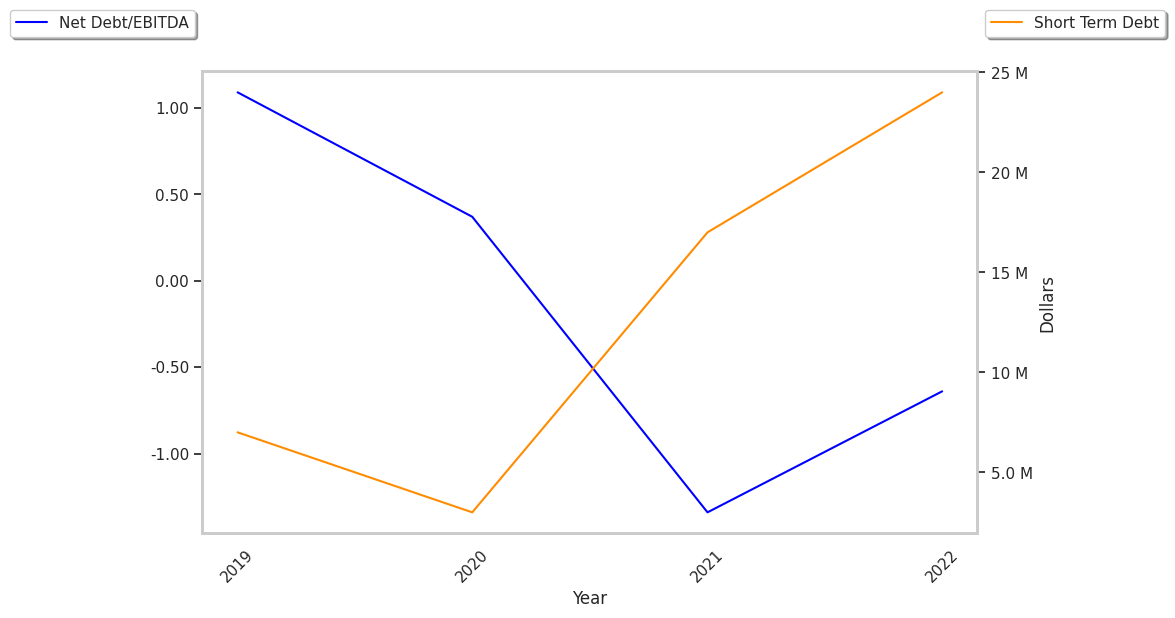
| Net Debt / EBITDA | -10.33 | -1.78 | -1.09 | -0.89 | -0.09 | -0.22 |
| Current Ratio | 1.64 | 1.73 | 1.63 | 1.56 | 1.56 | 1.45 |
Corteva has generally positive cash flows, a strong EPS growth trend, and healthy leverage levels. Furthermore, Corteva has growing revenues and decreasing reinvestment in the business, weak operating margins with a positive growth rate, and just enough current assets to cover current liabilities, as shown by its current ratio of 1.45.
a Lower P/B Ratio Than Its Sector Average but Trading Above Its Fair Price:
Corteva has a trailing twelve month P/E ratio of 33.3, compared to an average of 25.91 for the Consumer Staples sector. Based on its EPS guidance of $3.21, the company has a forward P/E ratio of 22.5. Corteva's PEG ratio is 2.46 on the basis of the 13.5% weighted average of the company and the broader market's EPS compound average growth rates. This suggests that the company's shares are overvalued. In contrast, the market is likely undervaluing Corteva in terms of its equity because its P/B ratio is 1.77 while the sector average is 3.03. The company's shares are currently trading 113.8% below their Graham number.
Corteva Has an Average Rating of Buy:
The 22 analysts following Corteva have set target prices ranging from $68.0 to $92.0 per share, for an average of $81.36 with a buy rating. The company is trading -16.9% away from its average target price, indicating that there is an analyst consensus of some upside potential.
Corteva has a very low short interest because 1.1% of the company's shares are sold short. Institutions own 86.8% of the company's shares, and the insider ownership rate stands at 0.09%, suggesting a small amount of insider investors. The largest shareholder is Vanguard Group Inc, whose 12% stake in the company is worth $5,420,730,715.