Today we're going to take a closer look at Large-Cap Consumer Discretionary company Tapestry, whose shares are currently trading at $108.15. We've been asking ourselves whether the company is under or over valued at today's prices... let's perform a brief value analysis to find out!
Tapestry's Valuation Is in Line With Its Sector Averages:
Tapestry, Inc. provides accessories and lifestyle brand products in North America, Greater China, rest of Asia, and internationally. The company belongs to the Consumer Discretionary sector, which has an average price to earnings (P/E) ratio of 20.93 and an average price to book (P/B) ratio of 2.93. In contrast, Tapestry has a trailing 12 month P/E ratio of 131.9 and a P/B ratio of 26.24.
Tapestry has moved 124.9% over the last year compared to 15.1% for the S&P 500 — a difference of 109.8%. Tapestry has a 52 week high of $117.0 and a 52 week low of $43.07.
Wider Gross Margins Than the Industry Average of 54.69%:
| 2019 | 2020 | 2021 | 2022 | 2023 | 2024 | |
|---|---|---|---|---|---|---|
| Revenue (M) | $6,027 | $4,961 | $5,746 | $6,684 | $6,661 | $6,671 |
| Gross Margins | 67% | 65% | 71% | 70% | 71% | 73% |
| Net Margins | 11% | -13% | 15% | 13% | 14% | 12% |
| Net Income (M) | $643 | -$652 | $834 | $856 | $936 | $816 |
| Net Interest Expense (M) | -$48 | -$60 | -$71 | -$59 | -$28 | -$125 |
| Depreciation & Amort. (M) | $270 | $829 | $220 | $195 | $182 | $174 |
| Diluted Shares (M) | 277 | 281 | 285 | 243 | 232 | 225 |
| Earnings Per Share | $2.21 | -$2.34 | $2.95 | $3.17 | $3.88 | $3.5 |
| EPS Growth | n/a | -205.88% | 226.07% | 7.46% | 22.4% | -9.79% |
| Avg. Price | $26.73 | $18.27 | $39.2 | $34.01 | $36.81 | $107.8 |
| P/E Ratio | 12.04 | -7.81 | 13.07 | 10.5 | 9.3 | 30.28 |
| Free Cash Flow (M) | $518 | $202 | $1,208 | $759 | $791 | $1,147 |
| CAPEX (M) | $274 | $205 | $116 | $94 | $184 | $109 |
| EV / EBITDA | 7.68 | 20.49 | 9.17 | 6.6 | 6.85 | 20.18 |
| Total Debt (M) | $1,599 | $2,301 | $1,191 | $1,679 | $7,739 | $2,681 |
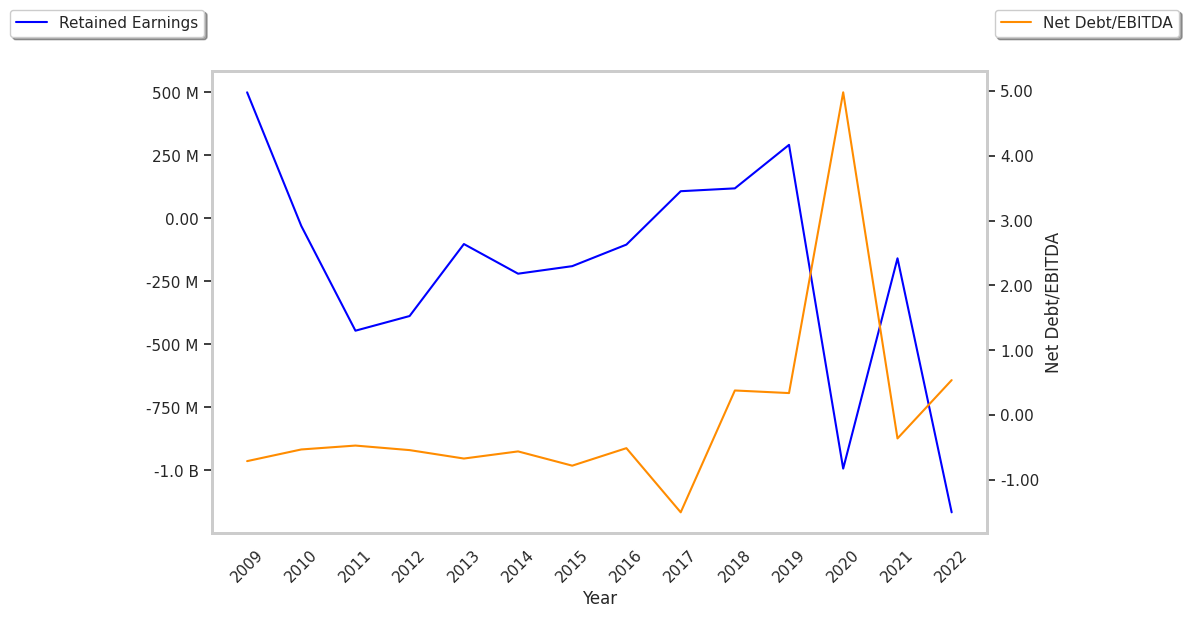
| Net Debt / EBITDA | 0.64 | 2.36 | -0.05 | 0.62 | 0.67 | 1.29 |
| Current Ratio | 2.01 | 1.88 | 1.87 | 1.87 | 6.25 | 1.58 |
Tapestry benefits from generally positive cash flows, wider gross margins than its peer group, and positive EPS growth. The company's financial statements show a decent current ratio of 1.58 and healthy leverage levels. Furthermore, Tapestry has growing revenues and decreasing reinvestment in the business.