It's been a great morning session for Howmet Aerospace investors, who saw their shares rise 1.7% to a price of $193.15 per share. At these higher prices, is the company still fairly valued? If you are thinking about investing, make sure to check the company's fundamentals before making a decision.
The Market May Be Overvaluing Howmet Aerospace's Earnings and Assets:
Howmet Aerospace Inc. provides advanced engineered solutions for the aerospace and transportation industries in the United States, Japan, France, Germany, the United Kingdom, Mexico, Italy, Canada, Poland, China, and internationally. The company belongs to the Industrials sector, which has an average price to earnings (P/E) ratio of 24.03 and an average price to book (P/B) ratio of 2.89. In contrast, Howmet Aerospace has a trailing 12 month P/E ratio of 56.5 and a P/B ratio of 15.65.
Howmet Aerospace has moved 92.7% over the last year compared to 15.3% for the S&P 500 -- a difference of 77.4%. Howmet Aerospace has a 52 week high of $194.89 and a 52 week low of $97.86.
Generally Positive Cash Flows but Growing Revenues:
| 2019 | 2020 | 2021 | 2022 | 2023 | 2024 | |
|---|---|---|---|---|---|---|
| Revenue (M) | $7,098 | $5,259 | $4,972 | $5,663 | $6,640 | $7,430 |
| Operating Margins | 8% | 12% | 15% | 16% | 18% | 22% |
| Net Margins | 7% | 5% | 5% | 8% | 12% | 16% |
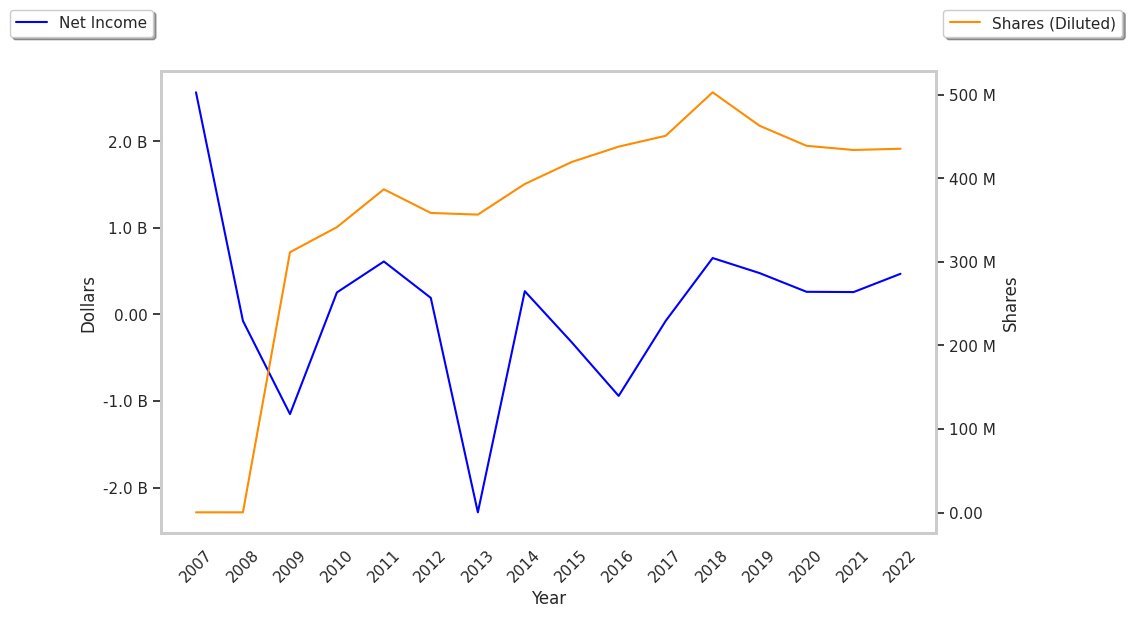
| Net Income (M) | $470 | $261 | $258 | $469 | $765 | $1,155 |
| Net Interest Expense (M) | $24 | $5 | -$259 | -$229 | -$161 | -$182 |
| Depreciation & Amort. (M) | $295 | $279 | $270 | $265 | $272 | $243 |
| Diluted Shares (M) | 463 | 439 | 435 | 421 | 416 | 410 |
| Earnings Per Share | $1.02 | $0.59 | $0.59 | $1.11 | $1.84 | $2.82 |
| EPS Growth | n/a | -42.16% | 0.0% | 88.14% | 65.77% | 53.26% |
| Avg. Price | $23.75 | $19.65 | $31.13 | $33.97 | $54.12 | $193.15 |
| P/E Ratio | 24.48 | 32.75 | 52.76 | 30.33 | 29.1 | 68.74 |
| Free Cash Flow (M) | -$180 | -$258 | $250 | $540 | $682 | $977 |
| CAPEX (M) | $641 | $267 | $199 | $193 | $219 | $321 |
| EV / EBITDA | 18.17 | 13.29 | 16.71 | 14.87 | 17.42 | 43.71 |
| Total Debt (M) | $5,940 | $5,075 | $4,232 | $4,162 | $3,989 | $3,315 |
| Net Debt / EBITDA | 4.99 | 3.83 | 3.45 | 2.85 | 2.29 | 1.47 |
| Current Ratio | 1.42 | 2.21 | 2.18 | 2.12 | 1.86 | 2.17 |
Howmet Aerospace benefits from strong operating margins with a positive growth rate, generally positive cash flows, and an excellent current ratio of 2.17. The company's financial statements show a strong EPS growth trend and healthy leverage levels. Furthermore, Howmet Aerospace has growing revenues and decreasing reinvestment in the business.