It's been a great afternoon session for Southwest Airlines investors, who saw their shares rise 1.9% to a price of $32.53 per share. At these higher prices, is the company still fairly valued? If you are thinking about investing, make sure to check the company's fundamentals before making a decision.
a Lower P/B Ratio Than Its Sector Average but Trading Above Its Fair Price:
Southwest Airlines Co. operates as a passenger airline company that provides scheduled air transportation services in the United States and near-international markets. The company belongs to the Consumer Discretionary sector, which has an average price to earnings (P/E) ratio of 20.93 and an average price to book (P/B) ratio of 2.93. In contrast, Southwest Airlines has a trailing 12 month P/E ratio of 50.8 and a P/B ratio of 2.14.
Southwest Airlines has moved 9.8% over the last year compared to 15.3% for the S&P 500 -- a difference of -5.5%. Southwest Airlines has a 52 week high of $37.96 and a 52 week low of $23.82.
Increasing Revenues but Narrowing Margins:
| 2019 | 2020 | 2021 | 2022 | 2023 | 2024 | |
|---|---|---|---|---|---|---|
| Revenue (M) | $22,428 | $9,048 | $15,790 | $23,814 | $26,091 | $27,483 |
| Operating Margins | 13% | -42% | 11% | 4% | 1% | 1% |
| Net Margins | 10% | -34% | 6% | 2% | 2% | 2% |
| Net Income (M) | $2,300 | -$3,074 | $977 | $539 | $465 | $465 |
| Net Interest Expense (M) | $118 | $349 | $467 | $340 | $259 | $220 |
| Depreciation & Amort. (M) | $1,219 | $1,255 | $1,272 | $1,351 | $1,522 | $1,657 |
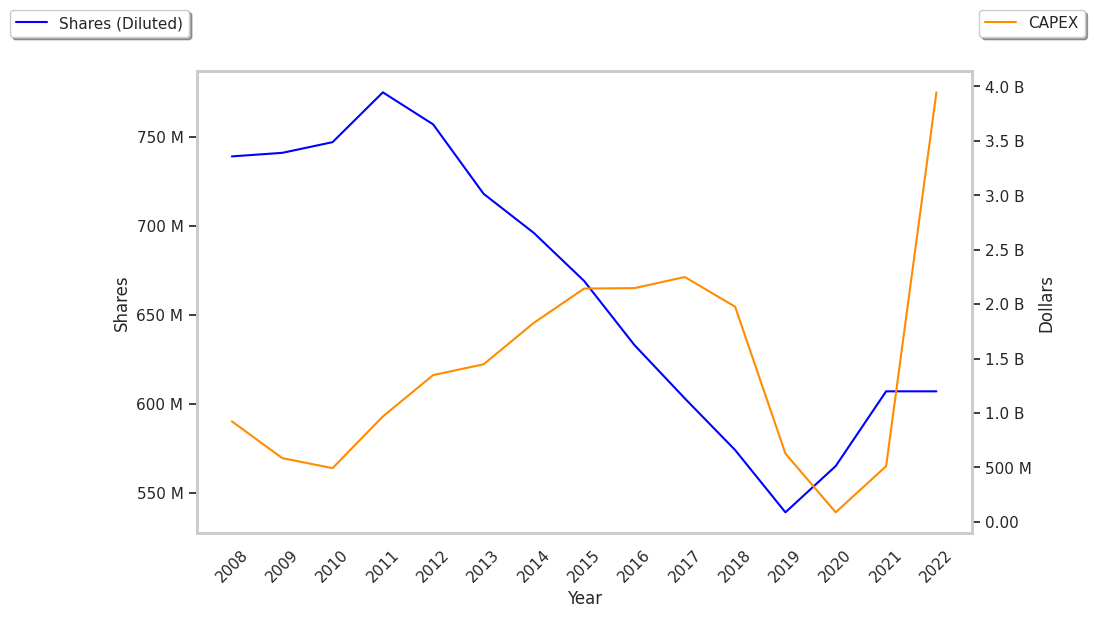
| Diluted Shares (M) | 539 | 565 | 609 | 642 | 640 | 643 |
| Earnings Per Share | $4.27 | -$5.44 | $1.61 | $0.87 | $0.76 | $0.76 |
| EPS Growth | n/a | -227.4% | 129.6% | -45.96% | -12.64% | 0.0% |
| Avg. Price | $51.68 | $39.35 | $51.8 | $42.54 | $28.88 | $32.53 |
| P/E Ratio | 12.07 | -7.23 | 31.39 | 46.75 | 37.03 | 41.71 |
| Free Cash Flow (M) | $2,960 | -$1,642 | $1,817 | -$134 | -$356 | -$1,592 |
| CAPEX (M) | $1,027 | $515 | $505 | $3,924 | $3,520 | $2,054 |
| EV / EBITDA | 7.11 | -11.52 | 12.92 | 13.43 | 13.65 | 11.96 |
| Total Debt (M) | $3,692 | $20,222 | $20,548 | $16,092 | $15,956 | $11,766 |
| Net Debt / EBITDA | 0.27 | -3.58 | 2.7 | 2.79 | 3.82 | 2.15 |
| Current Ratio | 0.67 | 2.02 | 1.97 | 1.43 | 1.14 | 0.92 |
Southwest Airlines's financial statements include several red flags such as weak operating margins with a negative growth trend, declining EPS growth, and positive cash flows. Additionally, the firm has not enough current assets to cover current liabilities because its current ratio is 0.92. On the other hand, the company benefits from growing revenues and increasing reinvestment in the business and healthy leverage levels.