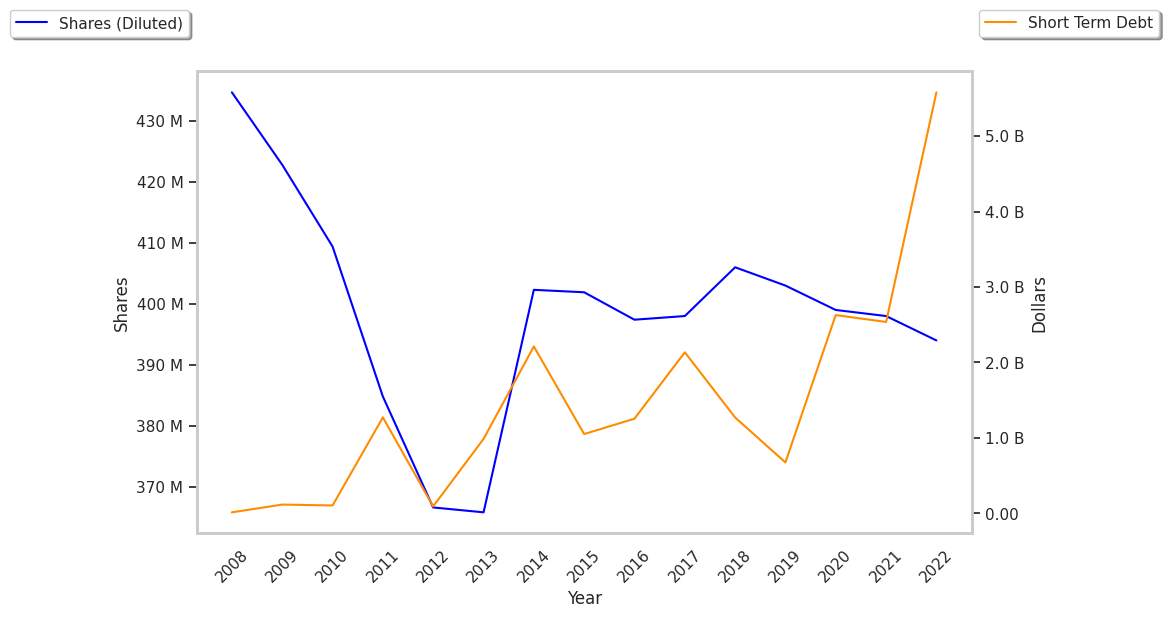
Shares of Industrials sector company Thermo Fisher Scientific Inc moved 4.9% today, and are now trading at a price of $484.75. The Large-Cap stock's daily volume was 3,312,984 compared to its average volume of 2,404,860. The S&P 500 index returned a 0.0% performance.
Thermo Fisher Scientific Inc. provides life sciences solutions, analytical instruments, specialty diagnostics, and laboratory products and biopharma services in the North America, Europe, Asia-Pacific, and internationally. The company is based in Waltham and has 125,000 full time employees. Its market capitalization is $183,919,050,752. Thermo Fisher Scientific Inc currently offers its equity investors a dividend that yields 0.4% per year.
23 analysts are following Thermo Fisher Scientific Inc and have set target prices ranging from $500.0 to $630.0 per share. On average, they have given the company a rating of buy. At today's prices, TMO is trading -11.24% away from its average analyst target price of $546.14 per share.
Over the last year, TMO shares have gone down by -24.6%, which represents a difference of -41.3% when compared to the S&P 500. The stock's 52 week high is $620.0 per share and its 52 week low is $385.46. With average free cash flows of $6.46 Billion that have been growing at an average rate of 6.0% over the last 5 years, Thermo Fisher Scientific Inc declining stock performance may not be reflective of the quality of its underlying business.
| Date Reported | Cash Flow from Operations ($ k) | Capital expenditures ($ k) | Free Cash Flow ($ k) | YoY Growth (%) |
|---|---|---|---|---|
| 2024 | 8,667,000 | 1,400,000 | 7,267,000 | 4.91 |
| 2023 | 8,406,000 | 1,479,000 | 6,927,000 | 0.23 |
| 2022 | 9,154,000 | 2,243,000 | 6,911,000 | 1.8 |
| 2021 | 9,312,000 | 2,523,000 | 6,789,000 | -0.38 |
| 2020 | 8,289,000 | 1,474,000 | 6,815,000 | 68.4 |
| 2019 | 4,973,000 | 926,000 | 4,047,000 |


