Uber Technologies logged a -1.7% change during today's afternoon session, and is now trading at a price of $97.86 per share.
Uber Technologies returned gains of 34.1% last year, with its stock price reaching a high of $101.99 and a low of $59.33. Over the same period, the stock outperformed the S&P 500 index by 17.4%. More recently, the company's 50-day average price was $93.38. Uber Technologies, Inc. develops and operates proprietary technology applications in the United States, Canada, Latin America, Europe, the Middle East, Africa, and the Asia Pacific. Based in San Francisco, CA, the Large-Cap Real Estate company has 32,700 full time employees. Uber Technologies has not offered a dividend during the last year.
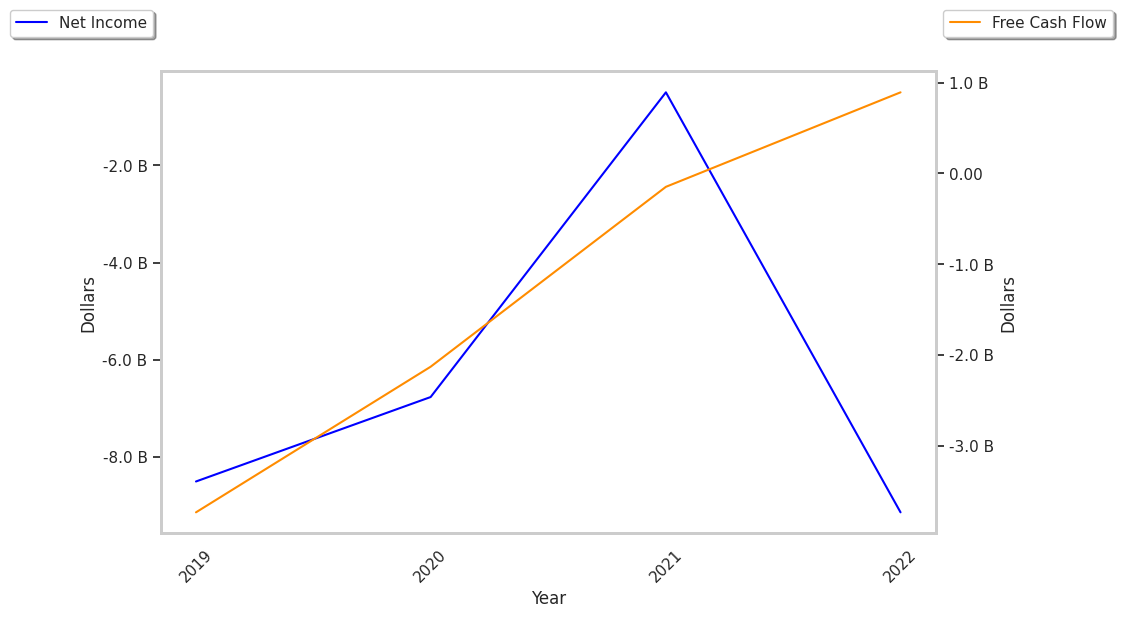
The Firm Has a Highly Leveraged Balance Sheet:
| 2019 | 2020 | 2021 | 2022 | 2023 | 2024 | |
|---|---|---|---|---|---|---|
| Revenue (M) | $13,000 | $11,139 | $17,455 | $31,877 | $37,281 | $43,978 |
| Operating Margins | -66% | -44% | -22% | -6% | 3% | 6% |
| Net Margins | -65% | -61% | -3% | -28% | 5% | 22% |
| Net Income (M) | -$8,506 | -$6,768 | -$496 | -$9,141 | $1,887 | $9,856 |
| Net Interest Expense (M) | $559 | $458 | $483 | $565 | $633 | $489 |
| Depreciation & Amort. (M) | $472 | $575 | $902 | $947 | $823 | $332 |
| Diluted Shares (M) | 1,248 | 1,753 | 1,896 | 1,975 | 2,092 | 2,151 |
| Earnings Per Share | -$6.81 | -$3.86 | -$0.29 | -$4.65 | $0.87 | $4.56 |
| EPS Growth | n/a | 43.32% | 92.49% | -1503.45% | 118.71% | 424.14% |
| Avg. Price | $35.54 | $35.51 | $48.61 | $30.9 | $61.57 | $97.72 |
| P/E Ratio | -5.22 | -9.2 | -186.96 | -6.66 | 66.2 | 20.75 |
| Free Cash Flow (M) | -$4,909 | -$3,361 | -$743 | $390 | $3,362 | $6,895 |
| CAPEX (M) | $588 | $616 | $298 | $252 | $223 | $242 |
| EV / EBITDA | -5.54 | -16.57 | -35.71 | -84.53 | 71.44 | 68.65 |
| Total Debt (M) | $11,498 | $15,474 | $18,664 | $18,626 | $19,019 | $17,922 |
| Net Debt / EBITDA | -0.08 | -2.29 | -4.9 | -16.29 | 7.42 | 3.84 |
| Current Ratio | 2.47 | 1.44 | 0.98 | 1.04 | 1.19 | 1.07 |
Uber Technologies has generally positive cash flows, rapidly growing revenues and decreasing reinvestment in the business, and positive EPS growth. However, the firm has a highly leveraged balance sheet. Finally, we note that Uber Technologies has weak operating margins with a stable trend and just enough current assets to cover current liabilities, as shown by its current ratio of 1.07.
a Decline in Expected Earnings Clouds Its Value Outlook but Its Shares Are Expensive:
Uber Technologies has a trailing twelve month P/E ratio of 15.7, compared to an average of 27.31 for the Real Estate sector. Based on its EPS guidance of $2.36, the company has a forward P/E ratio of 39.6. The 4.3% compound average growth rate of Uber Technologies's historical and projected earnings per share yields a PEG ratio of 3.63. This suggests that these shares are overvalued. Furthermore, Uber Technologies is likely overvalued compared to the book value of its equity, since its P/B ratio of 9.04 is higher than the sector average of 1.94. The company's shares are currently trading 205.1% below their Graham number. Ultimately, Uber Technologies's strong cash flows, decent earnings multiple, and healthy debt levels factor towards it being fairly valued, its elevated P/B ratio notwithstanding.
Uber Technologies Has an Average Rating of Buy:
The 50 analysts following Uber Technologies have set target prices ranging from $82.0 to $150.0 per share, for an average of $107.1 with a buy rating. The company is trading -8.6% away from its average target price, indicating that there is an analyst consensus of some upside potential.
Uber Technologies has an average amount of shares sold short because 2.6% of the company's shares are sold short. Institutions own 84.4% of the company's shares, and the insider ownership rate stands at 0.45%, suggesting a small amount of insider investors. The largest shareholder is Vanguard Group Inc, whose 9% stake in the company is worth $18,548,564,528.