It's been a great afternoon session for Verizon Communications investors, who saw their shares rise 1.4% to a price of $43.85 per share. At these higher prices, is the company still fairly valued? If you are thinking about investing, make sure to check the company's fundamentals before making a decision.
Verizon Communications Is Currently Undervalued:
Verizon Communications Inc., through its subsidiaries, engages in the provision of communications, technology, information, and entertainment products and services to consumers, businesses, and governmental entities worldwide. The company belongs to the Telecommunications sector, which has an average price to earnings (P/E) ratio of 18.22 and an average price to book (P/B) ratio of 1.86. In contrast, Verizon Communications has a trailing 12 month P/E ratio of 10.3 and a P/B ratio of 1.79.
Verizon Communications has moved -4.3% over the last year compared to 16.7% for the S&P 500 — a difference of -21.0%. Verizon Communications has a 52 week high of $47.36 and a 52 week low of $37.59.
The Company's Revenues Are Declining:
| 2019 | 2020 | 2021 | 2022 | 2023 | 2024 | |
|---|---|---|---|---|---|---|
| Revenue (M) | $131,868 | $128,292 | $133,613 | $136,835 | $133,974 | $134,788 |
| Operating Margins | 23% | 22% | 24% | 22% | 17% | 21% |
| Net Margins | 15% | 14% | 17% | 16% | 9% | 13% |
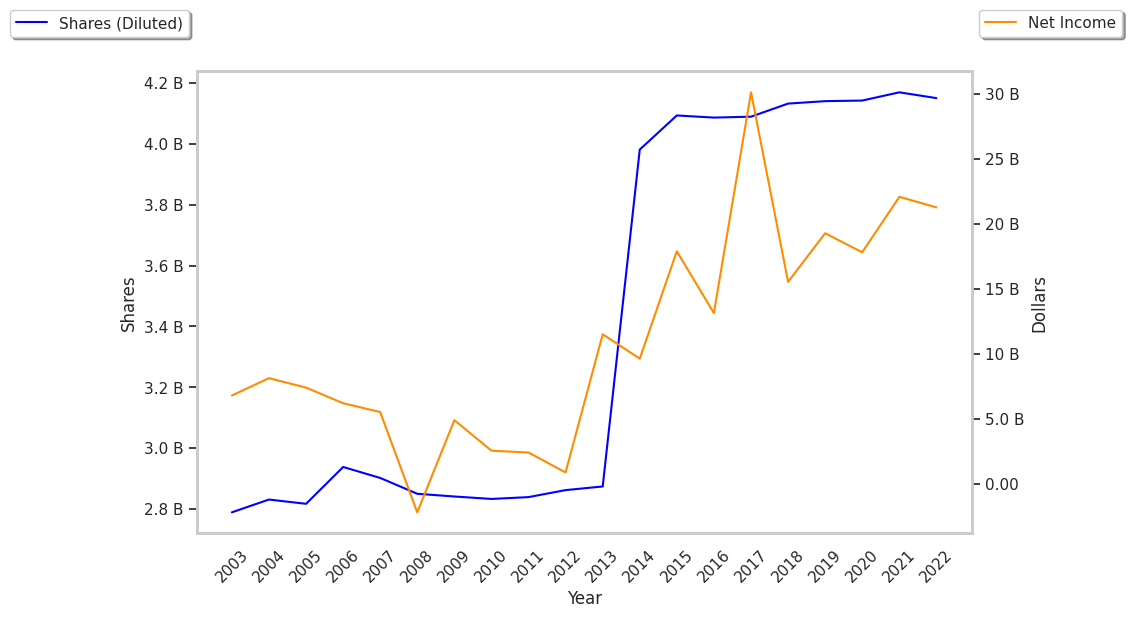
| Net Income (M) | $19,265 | $17,801 | $22,065 | $21,256 | $11,614 | $17,506 |
| Net Interest Expense (M) | $4,730 | $4,247 | $3,485 | $3,613 | $5,524 | $336 |
| Depreciation & Amort. (M) | $16,682 | $16,720 | $16,206 | $17,099 | $17,624 | $15,112 |
| Diluted Shares (M) | 4,140 | 4,142 | 4,150 | 4,204 | 4,215 | 4,223 |
| Earnings Per Share | $4.65 | $4.3 | $5.32 | $5.06 | $2.75 | $4.14 |
| EPS Growth | n/a | -7.53% | 23.72% | -4.89% | -45.65% | 50.55% |
| Avg. Price | $47.21 | $48.98 | $48.98 | $47.48 | $37.7 | $43.79 |
| P/E Ratio | 10.13 | 11.39 | 9.21 | 9.38 | 13.66 | 10.55 |
| Free Cash Flow (M) | $17,807 | $23,576 | $19,253 | $14,054 | $18,708 | $33,612 |
| CAPEX (M) | $17,939 | $18,192 | $20,286 | $23,087 | $18,767 | $3,300 |
| EV / EBITDA | 6.46 | 6.67 | 7.05 | 7.09 | 7.26 | 6.88 |
| Total Debt (M) | $111,489 | $123,173 | $143,425 | $140,676 | $137,701 | $121,381 |
| Net Debt / EBITDA | 2.31 | 2.22 | 2.89 | 2.9 | 3.35 | 2.68 |
| Current Ratio | 0.84 | 1.38 | 0.78 | 0.75 | 0.69 | 0.63 |