Today we're going to take a closer look at Large-Cap Consumer Discretionary company TechnipFMC, whose shares are currently trading at $38.4. We've been asking ourselves whether the company is under or over valued at today's prices... let's perform a brief value analysis to find out!
a Very Low P/E Ratio but Priced Beyond Its Margin of Safety:
TechnipFMC plc engages in the energy projects, technologies, systems, and services businesses in Europe, Central Asia, North America, Latin America, the Asia Pacific, Africa, the Middle East, and internationally. The company belongs to the Consumer Discretionary sector, which has an average price to earnings (P/E) ratio of 20.93 and an average price to book (P/B) ratio of 2.93. In contrast, TechnipFMC has a trailing 12 month P/E ratio of 18.3 and a P/B ratio of 4.85.
TechnipFMC has moved 40.3% over the last year compared to 16.8% for the S&P 500 -- a difference of 23.6%. TechnipFMC has a 52 week high of $41.3 and a 52 week low of $22.12.
Generally Positive Cash Flows but an Average Current Ratio:
| 2019 | 2020 | 2021 | 2022 | 2023 | 2024 | |
|---|---|---|---|---|---|---|
| Revenue (M) | $6,950 | $6,531 | $6,404 | $6,700 | $7,824 | $9,083 |
| Gross Margins | -34% | -54% | 1% | 3% | 7% | 38% |
| Net Margins | -35% | -50% | 0% | -2% | 1% | 9% |
| Net Income (M) | -$2,415 | -$3,288 | $13 | -$107 | $56 | $843 |
| Net Interest Expense (M) | $135 | $134 | $157 | $139 | $122 | -$64 |
| Depreciation & Amort. (M) | $363 | $309 | $291 | $377 | $378 | $280 |
| Diluted Shares (M) | 448 | 449 | 455 | 450 | 452 | 440 |
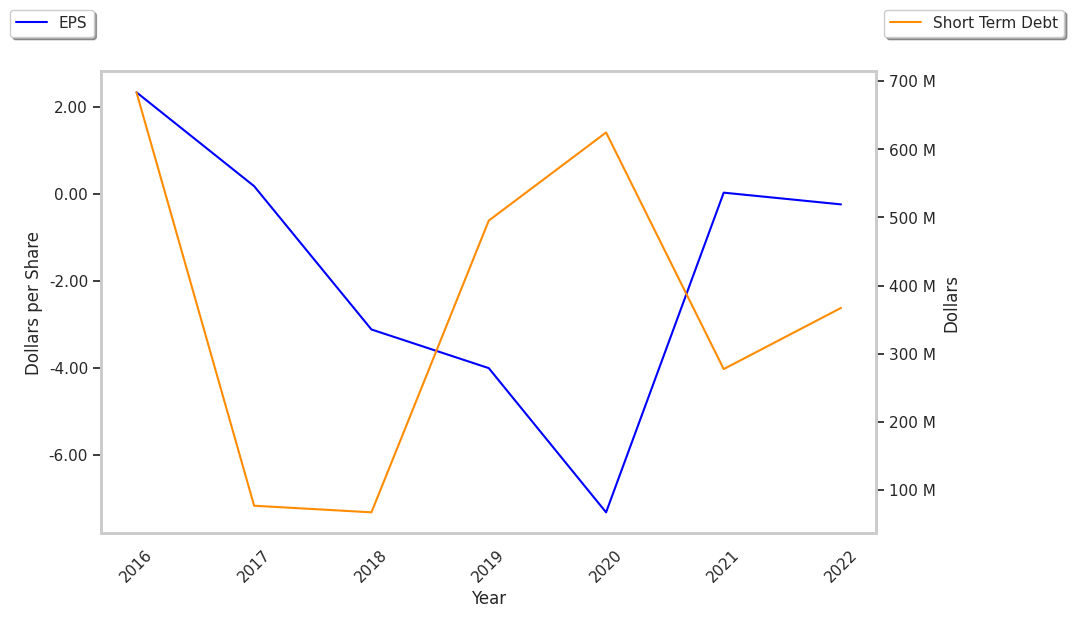
| Earnings Per Share | -$5.39 | -$7.33 | $0.03 | -$0.24 | $0.12 | $1.91 |
| EPS Growth | n/a | -35.99% | 100.41% | -900.0% | 150.0% | 1491.67% |
| Avg. Price | $16.6 | $7.0 | $7.66 | $7.27 | $20.14 | $38.42 |
| P/E Ratio | -3.08 | -0.95 | 255.33 | -30.29 | 154.92 | 19.6 |
| Free Cash Flow (M) | $436 | $401 | $590 | $194 | $468 | $679 |
| CAPEX (M) | $413 | $256 | $192 | $158 | $225 | $282 |
| EV / EBITDA | -4.93 | -2.71 | 11.96 | 10.28 | 17.0 | 11.8 |
| Total Debt (M) | $4,971 | $6,778 | $3,732 | $2,366 | $1,981 | $1,492 |
| Net Debt / EBITDA | -1.54 | -1.73 | 4.91 | 2.93 | 1.76 | 0.23 |
| Current Ratio | 1.17 | 1.1 | 1.39 | 1.2 | 1.16 | 1.12 |
TechnipFMC has generally positive cash flows, positive EPS growth, and healthy leverage levels. Furthermore, TechnipFMC has growing revenues and decreasing reinvestment in the business and just enough current assets to cover current liabilities, as shown by its current ratio of 1.12.