Now trading at a price of $63.05, Mondelez International has moved 2.0% so far today.
Mondelez International returned losses of -13.6% last year, with its stock price reaching a high of $72.7 and a low of $53.95. Over the same period, the stock underperformed the S&P 500 index by -30.4%. AThe company's 50-day average price was $63.11. Mondelez International, Inc., through its subsidiaries, manufactures, markets, and sells snack food and beverage products in the Latin America, North America, Asia, the Middle East, Africa, and Europe. Based in Chicago, IL, the Large-Cap Consumer Staples company has 90,000 full time employees. Mondelez International has offered a 3.0% dividend yield over the last 12 months.
Wider Gross Margins Than the Industry Average of 27.06%:
| 2019 | 2020 | 2021 | 2022 | 2023 | 2024 | |
|---|---|---|---|---|---|---|
| Revenue (M) | $25,868 | $26,581 | $28,720 | $31,496 | $36,016 | $36,441 |
| Gross Margins | 40% | 39% | 39% | 36% | 38% | 39% |
| Net Margins | 15% | 13% | 15% | 9% | 14% | 13% |
| Net Income (M) | $3,929 | $3,555 | $4,300 | $2,717 | $4,959 | $4,611 |
| Net Interest Expense (M) | $484 | -$608 | -$447 | -$423 | -$310 | $508 |
| Depreciation & Amort. (M) | $1,047 | $1,116 | $1,113 | $1,107 | $1,215 | $614 |
| Diluted Shares (M) | 1,453 | 1,439 | 1,413 | 1,385 | 1,370 | 1,347 |
| Earnings Per Share | $2.69 | $2.47 | $3.04 | $1.96 | $3.62 | $3.42 |
| EPS Growth | n/a | -8.18% | 23.08% | -35.53% | 84.69% | -5.52% |
| Avg. Price | $47.11 | $50.94 | $57.72 | $62.1 | $72.43 | $63.24 |
| P/E Ratio | 17.32 | 20.54 | 18.86 | 31.52 | 19.9 | 18.38 |
| Free Cash Flow (M) | $3,040 | $3,101 | $3,176 | $3,002 | $3,602 | $3,523 |
| CAPEX (M) | $925 | $863 | $965 | $906 | $1,112 | $1,387 |
| EV / EBITDA | 16.88 | 17.99 | 16.87 | 22.61 | 17.26 | 14.77 |
| Total Debt (M) | $15,788 | $20,017 | $19,296 | $20,634 | $18,988 | $17,678 |
| Net Debt / EBITDA | 2.96 | 3.3 | 2.73 | 4.03 | 2.56 | 2.53 |
| Current Ratio | 0.5 | 0.66 | 0.74 | 0.6 | 0.62 | 0.68 |
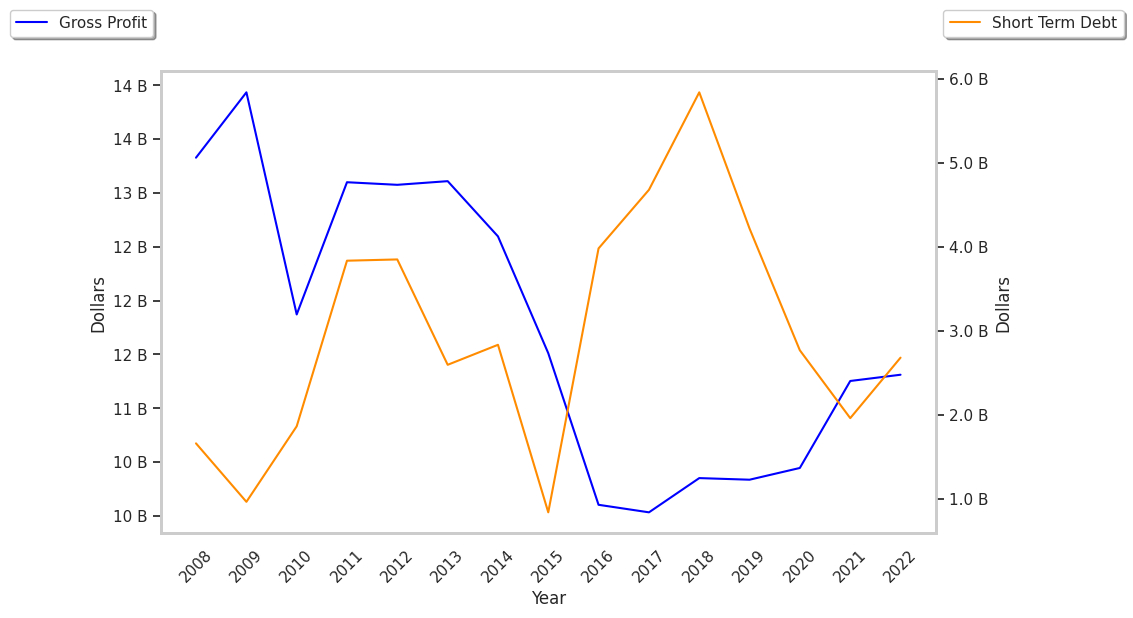
Mondelez International has growing revenues and increasing reinvestment in the business and wider gross margins than its peer group. Additionally, the company's financial statements display positive EPS growth and generally positive cash flows. However, the firm has not enough current assets to cover current liabilities because its current ratio is 0.68. Finally, we note that Mondelez International has significant leverage levels.
an Increase in Expected Earnings Improves Its Value Outlook but Priced Beyond Its Margin of Safety:
Mondelez International has a trailing twelve month P/E ratio of 23.1, compared to an average of 25.91 for the Consumer Staples sector. Based on its EPS guidance of $3.43, the company has a forward P/E ratio of 18.4. The 3.5% compound average growth rate of Mondelez International's historical and projected earnings per share yields a PEG ratio of 6.54. This suggests that these shares are overvalued. The market is placing a fair value on Mondelez International's equity, since its P/B ratio of 3.11 is comparable to its sector average of 3.03. The company's shares are currently trading 60.7% below their Graham number.
Mondelez International Has an Average Rating of Buy:
The 24 analysts following Mondelez International have set target prices ranging from $67.0 to $88.0 per share, for an average of $73.54 with a buy rating. The company is trading -14.3% away from its average target price, indicating that there is an analyst consensus of some upside potential.
Mondelez International has a very low short interest because 1.9% of the company's shares are sold short. Institutions own 88.3% of the company's shares, and the insider ownership rate stands at 0.21%, suggesting a small amount of insider investors. The largest shareholder is Vanguard Group Inc, whose 10% stake in the company is worth $8,091,030,769.