Now trading at a price of $25.57, Kinross Gold has moved 2.2% so far today.
Kinross Gold returned gains of 168.3% last year, with its stock price reaching a high of $25.79 and a low of $8.99. Over the same period, the stock outperformed the S&P 500 index by 150.4%. More recently, the company's 50-day average price was $20.81. Kinross Gold Corporation, together with its subsidiaries, engages in the acquisition, exploration, and development of gold properties principally in the United States, Brazil, Chile, Canada, and Mauritania. The Large-Cap Basic Materials company is headquartered in Toronto, Canada. Kinross Gold has offered a 0.5% dividend yield over the last 12 months.
Generally Positive Cash Flows but Slimmer Gross Margins than the Industry Average of 41.07%:
| 2019 | 2020 | 2021 | 2022 | 2023 | 2024 | |
|---|---|---|---|---|---|---|
| Revenue (M) | $3,497 | $4,213 | $2,600 | $3,455 | $4,240 | $5,149 |
| Gross Margins | 39% | 54% | 21% | 15% | 27% | 36% |
| Net Margins | 21% | 32% | 8% | -18% | 10% | 19% |
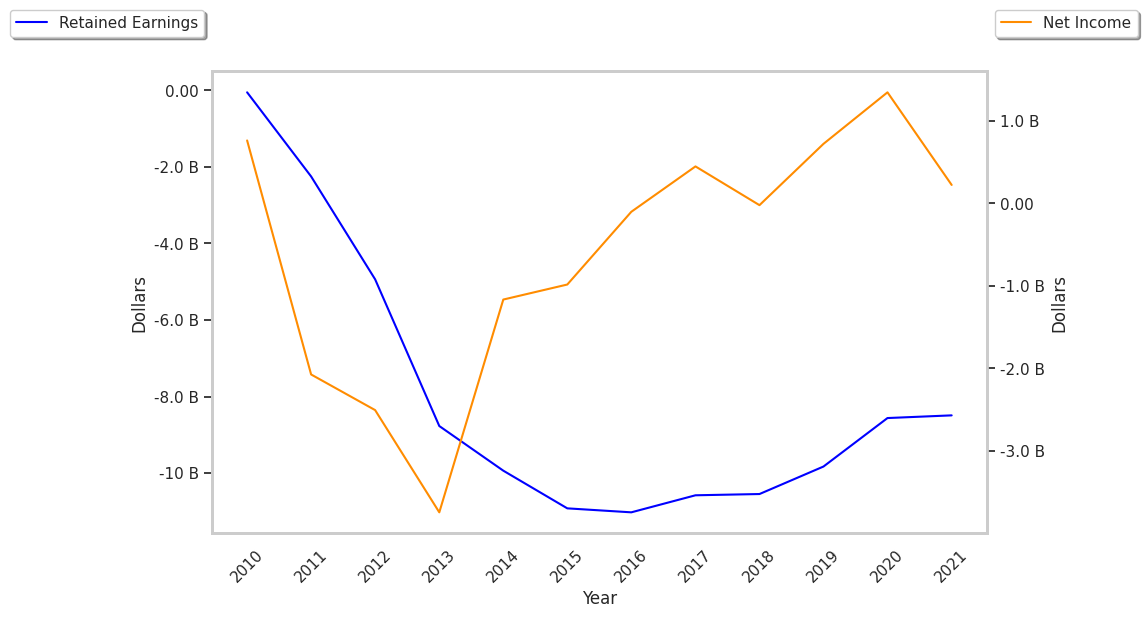
| Net Income (M) | $717 | $1,359 | $219 | -$606 | $415 | $994 |
| Net Interest Expense (M) | $77 | $90 | $72 | $68 | $69 | $50 |
| Depreciation & Amort. (M) | $731 | $842 | $696 | $784 | $987 | $1,148 |
| Earnings Per Share | $0.57 | $1.06 | $0.17 | -$0.47 | $0.34 | $0.77 |
| EPS Growth | n/a | 85.96% | -83.96% | -376.47% | 172.34% | 126.47% |
| Avg. Price | $3.69 | $6.52 | $6.22 | $4.94 | $6.05 | $25.51 |
| P/E Ratio | 6.47 | 6.09 | 34.56 | -10.51 | 17.79 | 33.13 |
| Free Cash Flow (M) | $1,225 | $1,958 | $1,135 | $1,143 | $1,605 | $2,446 |
| Total Debt (M) | $1,837 | $1,424 | $1,590 | $2,557 | $2,233 | $1,236 |
| Net Debt / EBITDA | 0.73 | 0.08 | 1.38 | 2.37 | 1.05 | 0.23 |
| Current Ratio | 2.96 | 1.82 | 2.63 | 2.47 | 2.63 | 2.01 |
Kinross Gold has generally positive cash flows and an excellent current ratio of 2.01. Additionally, the company's financial statements display positive EPS growth and healthy leverage levels. However, the firm has slimmer gross margins than its peers.
Kinross Gold's Valuation Is in Line With Its Sector Averages:
Kinross Gold has a trailing twelve month P/E ratio of 16.8, compared to an average of 20.25 for the Basic Materials sector. Based on its EPS guidance of $0.88, the company has a forward P/E ratio of 23.6. The 6.4% compound average growth rate of Kinross Gold's historical and projected earnings per share yields a PEG ratio of 2.62. This suggests that these shares are overvalued. Furthermore, Kinross Gold is likely overvalued compared to the book value of its equity, since its P/B ratio of 4.13 is higher than the sector average of 2.31. In conclusion, Kinross Gold's impressive cash flow trend, decent P/B ratio, and reasonable use of leverage demonstrate that the company may still be fairly valued — despite its elevated earnings multiple.
Kinross Gold Has an Average Rating of Buy:
The 10 analysts following Kinross Gold have set target prices ranging from $8.0 to $30.0 per share, for an average of $21.48 with a buy rating. The company is trading 19.0% away from its average target price, indicating that there is an analyst belief that shares are overpriced.
The largest shareholder is Van Eck Associates Corporation, whose 8% stake in the company is worth $2,560,960,041.