Now trading at a price of $106.79, T. Rowe Price has moved 1.0% so far today.
Over the last year, T. Rowe Price logged a -0.9% change, with its stock price reaching a high of $125.81 and a low of $77.85. Over the same period, the stock underperformed the S&P 500 index by -18.1%. AThe company's 50-day average price was $105.67. T. Rowe Price Group, Inc. is a publicly owned investment manager. Based in Baltimore, MD, the Large-Cap Finance company has 8,063 full time employees. T. Rowe Price has offered a 4.7% dividend yield over the last 12 months.
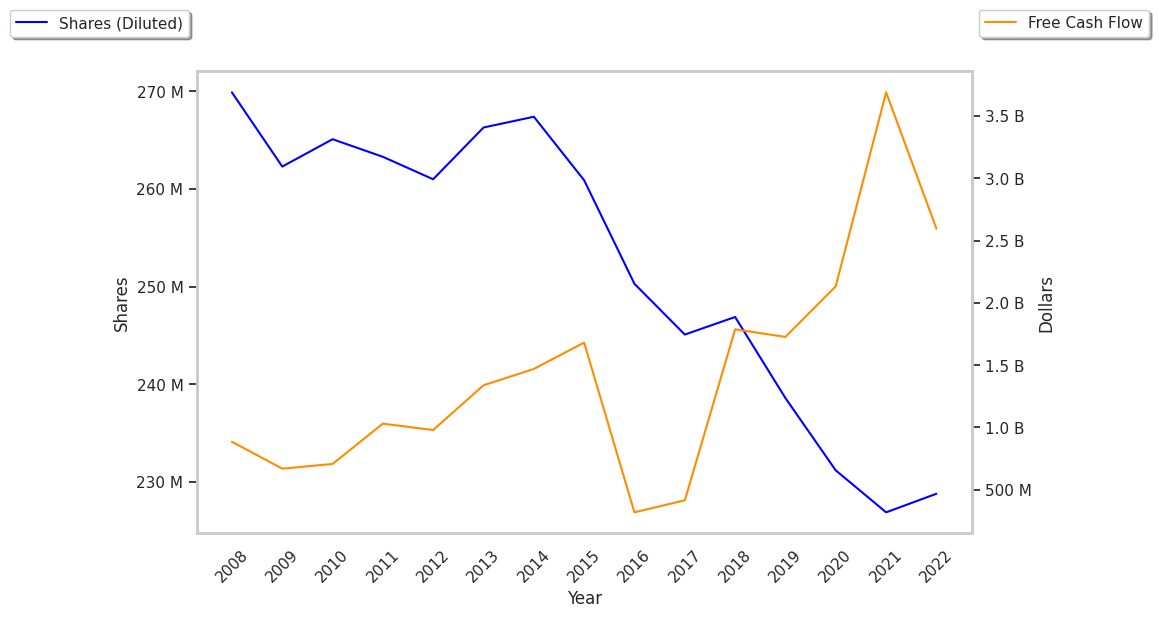
EPS Trend Sustained Primarily by Reducing the Number of Shares Outstanding:
| 2019 | 2020 | 2021 | 2022 | 2023 | 2024 | |
|---|---|---|---|---|---|---|
| Revenue (M) | $5,618 | $6,207 | $7,672 | $6,488 | $6,460 | $7,094 |
| Interest Income (M) | $540 | $496 | $285 | -$426 | $504 | $486 |
| Operating Margins | 42% | 44% | 48% | 37% | 31% | 33% |
| Net Margins | 38% | 38% | 40% | 24% | 28% | 30% |
| Net Income (M) | $2,131 | $2,373 | $3,083 | $1,558 | $1,789 | $2,100 |
| Depreciation & Amort. (M) | $191 | $190 | $205 | $226 | $255 | $254 |
| Diluted Shares (M) | 239 | 231 | 229 | 227 | 225 | 223 |
| Earnings Per Share | $8.7 | $9.98 | $13.12 | $6.7 | $7.76 | $9.15 |
| EPS Growth | n/a | 14.71% | 31.46% | -48.93% | 15.82% | 17.91% |
| Avg. Price | $93.42 | $114.03 | $176.49 | $132.09 | $107.69 | $105.69 |
| P/E Ratio | 10.59 | 11.31 | 13.32 | 19.63 | 13.84 | 11.51 |
| Free Cash Flow (M) | $1,318 | $1,704 | $3,213 | $2,122 | $911 | $1,262 |
| CAPEX (M) | $205 | $215 | $239 | $238 | $308 | $423 |
T. Rowe Price Is Overpriced:
T. Rowe Price has a trailing twelve month P/E ratio of 11.8, compared to an average of 15.92 for the Finance sector. Based on its EPS guidance of $9.35, the company has a forward P/E ratio of 11.3. The 1.0% compound average growth rate of T. Rowe Price's historical and projected earnings per share yields a PEG ratio of 11.44. This suggests that these shares are overvalued. Furthermore, T. Rowe Price is likely overvalued compared to the book value of its equity, since its P/B ratio of 2.22 is higher than the sector average of 1.78. The company's shares are currently trading 9.3% below their Graham number.
T. Rowe Price Has an Average Rating of Hold:
The 13 analysts following T. Rowe Price have set target prices ranging from $92.0 to $125.0 per share, for an average of $106.15 with a hold rating. The company is trading 0.6% away from its average target price, indicating that there is an analyst consensus of little upside potential.
T. Rowe Price has an average amount of shares sold short because 6.2% of the company's shares are sold short. Institutions own 80.6% of the company's shares, and the insider ownership rate stands at 1.71%, suggesting a large amount of insider shareholders. The largest shareholder is Vanguard Group Inc, whose 12% stake in the company is worth $2,821,041,339.