Arch Capital logged a -0.5% change during today's morning session, and is now trading at a price of $93.61 per share.
Arch Capital returned losses of -16.8% last year, with its stock price reaching a high of $116.41 and a low of $82.49. Over the same period, the stock underperformed the S&P 500 index by -32.7%. AThe company's 50-day average price was $90.16. Arch Capital Group Ltd., together with its subsidiaries, provides insurance, reinsurance, and mortgage insurance products in the United States, Canada, Bermuda, the United Kingdom, Europe, and Australia. Based in Pembroke, Bermuda, the Large-Cap Finance company has 7,200 full time employees. Arch Capital has not offered a dividend during the last year.
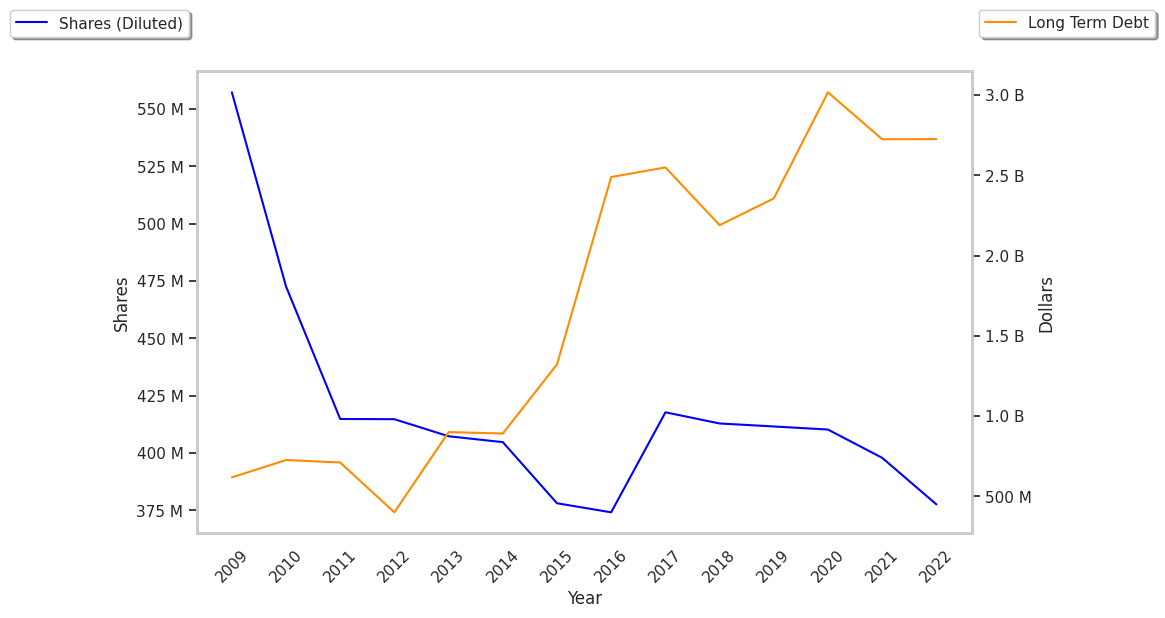
The Company May Be Profitable, but Its Balance Sheet Is Highly Leveraged:
| 2019 | 2020 | 2021 | 2022 | 2023 | 2024 | |
|---|---|---|---|---|---|---|
| Revenue (M) | $6,926 | $8,509 | $9,248 | $9,613 | $13,634 | $17,440 |
| Interest Income (M) | $121 | $143 | $139 | $131 | $133 | $141 |
| Operating Margins | 27% | 19% | 26% | 16% | 26% | 27% |
| Net Margins | 24% | 17% | 23% | 15% | 33% | 25% |
| Net Income (M) | $1,636 | $1,406 | $2,157 | $1,476 | $4,443 | $4,312 |
| Depreciation & Amort. (M) | $82 | $69 | $82 | $106 | $95 | $235 |
| Diluted Shares (M) | 412 | 410 | 400 | 378 | 379 | 382 |
| Earnings Per Share | $3.98 | $3.43 | $5.39 | $3.91 | $11.73 | $11.29 |
| EPS Growth | n/a | -13.82% | 57.14% | -27.46% | 200.0% | -3.75% |
| Avg. Price | $36.44 | $32.83 | $39.35 | $46.36 | $74.27 | $94.1 |
| P/E Ratio | 8.95 | 9.49 | 7.36 | 11.92 | 6.2 | 8.17 |
| Free Cash Flow (M) | $2,011 | $2,847 | $3,384 | $3,766 | $5,697 | $6,622 |
| CAPEX (M) | $38 | $40 | $41 | $50 | $52 | $51 |
| EV / EBITDA | 8.44 | 9.39 | 7.23 | 23.46 | 14.44 | 13.04 |
| Total Debt (M) | $2,356 | $3,017 | $2,724 | $22,408 | $26,279 | $29,763 |
| Net Debt / EBITDA | 0.84 | 1.28 | 0.76 | 12.92 | 6.92 | 5.86 |
Arch Capital has rapidly growing revenues and increasing reinvestment in the business and generally positive cash flows. Additionally, the company's financial statements display decent operating margins with a stable trend and a strong EPS growth trend. However, the firm has a highly leveraged balance sheet.
Arch Capital Is Fairly Priced:
Arch Capital has a trailing twelve month P/E ratio of 9.3, compared to an average of 15.92 for the Finance sector. Based on its EPS guidance of $9.04, the company has a forward P/E ratio of 10.0. The 12.4% compound average growth rate of Arch Capital's historical and projected earnings per share yields a PEG ratio of 0.75. This suggests that its shares are undervalued. Additionally, the market is possibly undervaluing Arch Capital in terms of its equity because its P/B ratio is 1.58 whereas the sector average is 1.78. The company's shares are currently trading -20.5% above their Graham number.
There's an Analyst Consensus of Some Upside Potential for Arch Capital:
The 16 analysts following Arch Capital have set target prices ranging from $95.0 to $125.0 per share, for an average of $108.75 with a buy rating. The company is trading -13.9% away from its average target price, indicating that there is an analyst consensus of some upside potential.
Arch Capital has a very low short interest because 1.8% of the company's shares are sold short. Institutions own 92.1% of the company's shares, and the insider ownership rate stands at 3.1%, suggesting a large amount of insider shareholders. The largest shareholder is Vanguard Group Inc, whose 11% stake in the company is worth $3,970,426,706.