Now trading at a price of $116.47, Gilead Sciences has moved -0.3% so far today.
Gilead Sciences returned gains of 35.6% last year, with its stock price reaching a high of $121.83 and a low of $84.17. Over the same period, the stock outperformed the S&P 500 index by 19.6%. More recently, the company's 50-day average price was $114.43. Gilead Sciences, Inc., a biopharmaceutical company, discovers, develops, and commercializes medicines in the areas of unmet medical need in the United States, Europe, and internationally. Based in Foster City, CA, the Large-Cap Health Care company has 17,600 full time employees. Gilead Sciences has offered a 2.7% dividend yield over the last 12 months.
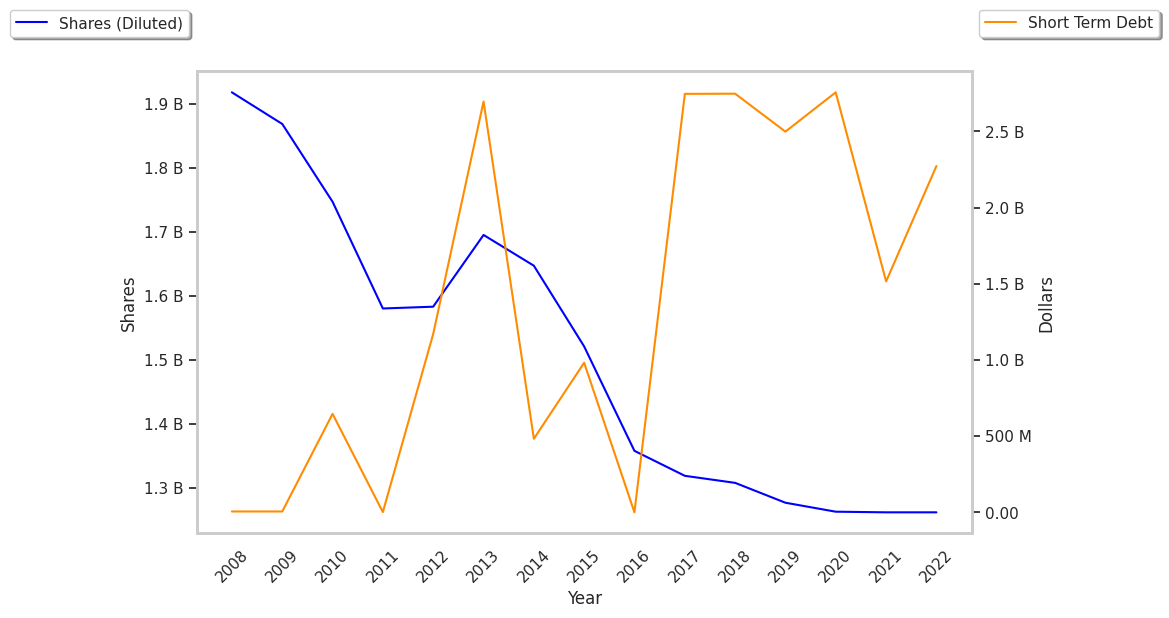
The Company Has a Highly Leveraged Balance Sheet and a Declining EPS Growth Trend:
| 2019 | 2020 | 2021 | 2022 | 2023 | 2024 | |
|---|---|---|---|---|---|---|
| Revenue (M) | $22,449 | $24,689 | $27,305 | $27,281 | $27,116 | $28,754 |
| Operating Margins | 19% | 16% | 36% | 27% | 28% | 6% |
| Net Margins | 24% | 0% | 23% | 17% | 21% | 2% |
| Net Income (M) | $5,386 | $123 | $6,225 | $4,592 | $5,665 | $480 |
| Net Interest Expense (M) | $995 | $984 | $1,001 | $935 | $944 | $951 |
| Depreciation & Amort. (M) | $255 | $288 | $329 | $323 | $354 | $381 |
| Diluted Shares (M) | 1,277 | 1,263 | 1,262 | 1,262 | 1,258 | 1,255 |
| Earnings Per Share | $4.22 | $0.1 | $4.93 | $3.64 | $4.5 | $0.38 |
| EPS Growth | n/a | -97.63% | 4830.0% | -26.17% | 23.63% | -91.56% |
| Avg. Price | $55.56 | $60.46 | $62.06 | $59.6 | $81.01 | $116.78 |
| P/E Ratio | 13.1 | 604.6 | 12.51 | 16.28 | 17.84 | 307.32 |
| Free Cash Flow (M) | $8,319 | $7,518 | $10,805 | $8,344 | $7,421 | $10,305 |
| CAPEX (M) | $825 | $650 | $579 | $728 | $585 | $523 |
| EV / EBITDA | 18.46 | 23.99 | 9.84 | 12.65 | 15.29 | 80.28 |
| Total Debt (M) | $24,593 | $34,159 | $28,211 | $27,502 | $26,785 | $28,525 |
| Net Debt / EBITDA | 2.85 | 6.46 | 2.23 | 2.89 | 2.6 | 9.07 |
| Current Ratio | 3.1 | 1.4 | 1.27 | 1.29 | 1.43 | 1.6 |
Gilead Sciences has weak operating margins with a negative growth trend, declining EPS growth, and a highly leveraged balance sheet. On the other hand, the company benefits from generally positive cash flows and a decent current ratio of 1.6. Furthermore, Gilead Sciences has growing revenues and decreasing reinvestment in the business.
Forward Earnings Show Improvement but Trades Above Its Graham Number:
Gilead Sciences has a trailing twelve month P/E ratio of 22.7, compared to an average of 22.94 for the Health Care sector. Based on its EPS guidance of $7.43, the company has a forward P/E ratio of 15.4. The 8.4% compound average growth rate of Gilead Sciences's historical and projected earnings per share yields a PEG ratio of 2.7. This suggests that these shares are overvalued. Furthermore, Gilead Sciences is likely overvalued compared to the book value of its equity, since its P/B ratio of 7.35 is higher than the sector average of 3.19. The company's shares are currently trading 914.5% below their Graham number. Ultimately, Gilead Sciences's strong cash flows, decent earnings multiple, and healthy debt levels factor towards it being fairly valued, its elevated P/B ratio notwithstanding.
Gilead Sciences Has an Average Rating of Buy:
The 25 analysts following Gilead Sciences have set target prices ranging from $98.0 to $145.0 per share, for an average of $125.19 with a buy rating. The company is trading -7.0% away from its average target price, indicating that there is an analyst consensus of some upside potential.
Gilead Sciences has a very low short interest because 1.5% of the company's shares are sold short. Institutions own 91.0% of the company's shares, and the insider ownership rate stands at 0.1%, suggesting a small amount of insider investors. The largest shareholder is Vanguard Group Inc, whose 10% stake in the company is worth $13,901,754,143.