We've been asking ourselves recently if the market has placed a fair valuation on PNC Financial Services. Let's dive into some of the fundamental values of this Large-Cap Finance company to determine if there might be an opportunity here for value-minded investors.
PNC Financial Services Is Trading Near Its Fair Value:
The PNC Financial Services Group, Inc. operates as a diversified financial services company in the United States. The company belongs to the Finance sector, which has an average price to earnings (P/E) ratio of 15.92 and an average price to book (P/B) ratio of 1.78. In contrast, PNC Financial Services has a trailing 12 month P/E ratio of 13.0 and a P/B ratio of 1.45.
PNC Financial Services has moved 3.7% over the last year compared to 16.8% for the S&P 500 — a difference of -13.1%. PNC Financial Services has a 52 week high of $216.26 and a 52 week low of $145.12.
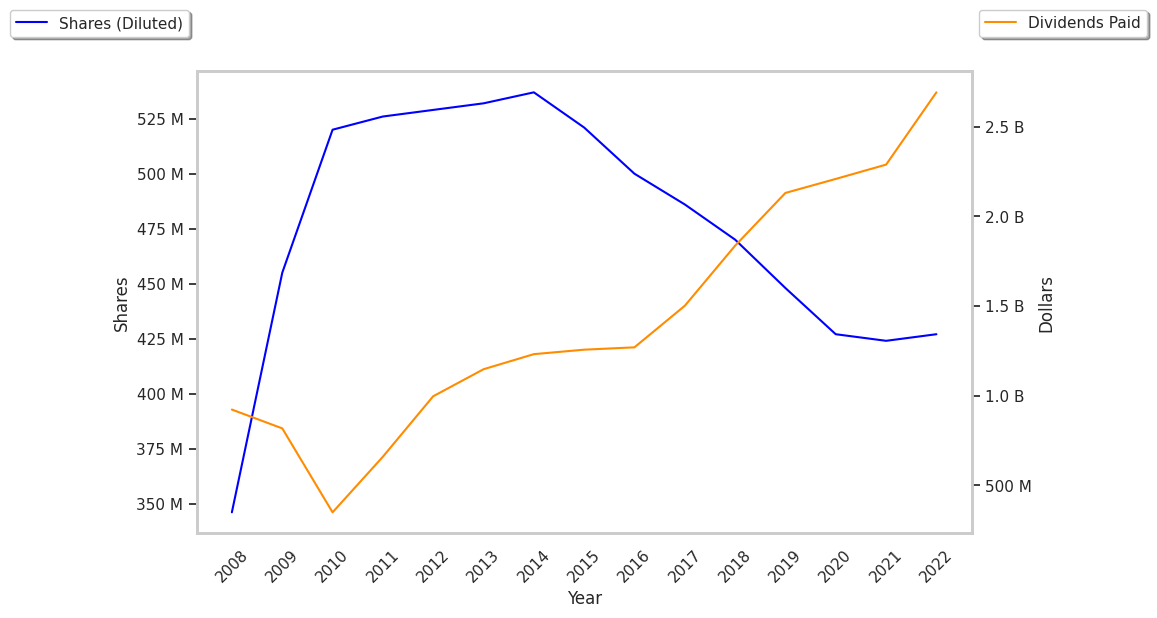
EPS Trend Sustained Primarily by Reducing the Number of Shares Outstanding:
| 2019 | 2020 | 2021 | 2022 | 2023 | 2024 | |
|---|---|---|---|---|---|---|
| Revenue (M) | $13,762 | $16,901 | $19,211 | $21,120 | $21,490 | $21,555 |
| Interest Income (M) | $9,965 | $9,946 | $10,647 | $13,014 | $13,916 | $13,499 |
| Operating Margins | 40% | 20% | 36% | 35% | 31% | 34% |
| Net Margins | 39% | 45% | 30% | 28% | 26% | 28% |
| Net Income (M) | $5,418 | $7,558 | $5,725 | $6,113 | $5,647 | $5,953 |
| Depreciation & Amort. (M) | $1,315 | $1,497 | $1,773 | $651 | $217 | $912 |
| Diluted Shares (M) | 448 | 427 | 426 | 412 | 401 | 400 |
| Earnings Per Share | $11.39 | $16.96 | $12.7 | $13.85 | $12.79 | $13.74 |
| EPS Growth | n/a | 48.9% | -25.12% | 9.06% | -7.65% | 7.43% |
| Avg. Price | $118.49 | $107.49 | $174.9 | $175.73 | $154.85 | $190.16 |
| P/E Ratio | 10.37 | 6.33 | 13.76 | 12.68 | 12.1 | 13.82 |
| Free Cash Flow (M) | $7,363 | $4,659 | $7,214 | $9,083 | $10,111 | $7,880 |
| EV / EBITDA | 8.05 | 9.23 | -0.13 | 12.05 | 12.07 | 11.17 |
| Total Debt (M) | $6,134 | $6,403 | $6,996 | $58,726 | $72,737 | $61,673 |
| Net Debt / EBITDA | 0.16 | -0.12 | -8.59 | 3.0 | 3.17 | 1.89 |