Now trading at a price of $41.05, Suncor Energy has moved 0.5% so far today.
Over the last year, Suncor Energy logged a 0.9% change, with its stock price reaching a high of $43.48 and a low of $30.79. Over the same period, the stock underperformed the S&P 500 index by -15.9%. AThe company's 50-day average price was $40.64. Suncor Energy Inc. operates as an integrated energy company in Canada, the United States, and internationally. Based in Calgary, Canada, the Large-Cap Energy company has 15,010 full time employees. Suncor Energy has offered a 5.5% dividend yield over the last 12 months.
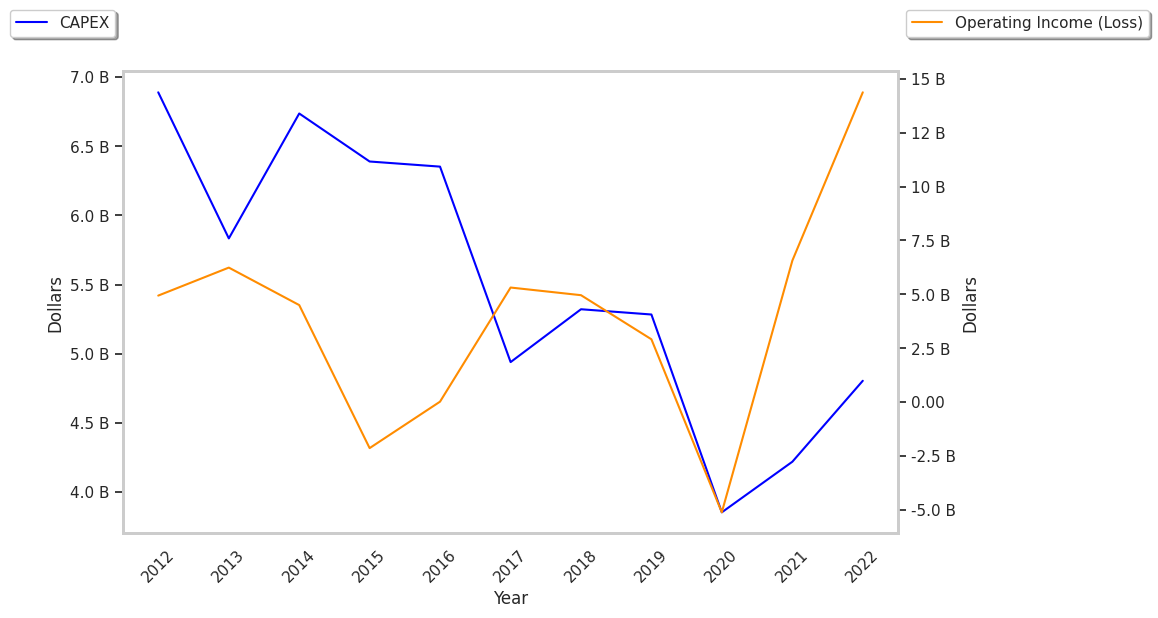
Generally Positive Cash Flows but an Average Current Ratio:
| 2019 | 2020 | 2021 | 2022 | 2023 | 2024 | |
|---|---|---|---|---|---|---|
| Revenue (M) | $38,989 | $25,052 | $39,101 | $62,907 | $52,206 | $54,881 |
| Net Margins | 7% | -17% | 11% | 14% | 16% | 11% |
| Net Income (M) | $2,899 | -$4,319 | $4,119 | $9,077 | $8,295 | $6,016 |
| Net Interest Expense (M) | $875 | $930 | $851 | $814 | $726 | $623 |
| Depreciation & Amort. (M) | $10,572 | $9,526 | $5,850 | $8,786 | $6,435 | $6,954 |
| Earnings Per Share | $1.86 | -$2.83 | $2.77 | $6.53 | $6.33 | $4.72 |
| EPS Growth | n/a | -252.1505376344086% | 197.8798586572438% | 135.74007220216606% | -3.06278713629403% | -25.43443917851501% |
| Avg. Price | $26.58 | $16.14 | $19.89 | $31.21 | $32.04 | $40.84 |
| P/E Ratio | 14.29 | -5.7 | 7.18 | 4.77 | 5.05 | 8.65 |
| Free Cash Flow (M) | $10,421 | $2,675 | $11,764 | $15,680 | $12,344 | $15,960 |
| Total Debt (M) | $12,884 | $13,812 | $13,989 | $9,800 | $11,087 | $9,348 |
| Current Ratio | 0.94 | 0.89 | 1.06 | 1.13 | 1.44 | 1.33 |
Suncor Energy's Earnings and Assets May Be Undervalued:
Suncor Energy has a trailing twelve month P/E ratio of 12.5, compared to an average of 18.35 for the Energy sector. Based on its EPS guidance of $3.16, the company has a forward P/E ratio of 12.9. The 7.9% compound average growth rate of Suncor Energy's historical and projected earnings per share yields a PEG ratio of 1.59. This suggests that these shares are overvalued. In contrast, the market is likely undervaluing Suncor Energy in terms of its equity because its P/B ratio is 1.12 while the sector average is 1.6.
Suncor Energy Has an Analyst Consensus of Some Upside Potential:
The 3 analysts following Suncor Energy have set target prices ranging from $37.205208 to $43.33097 per share, for an average of $41.13 with a buy rating. The company is trading -0.2% away from its average target price, indicating that there is an analyst consensus of some upside potential.
The largest shareholder is Royal Bank of Canada, whose 5% stake in the company is worth $2,518,980,944.