Enterprise Products shares fell by -1.5% during the day's afternoon session, and are now trading at a price of $30.79. Is it time to buy the dip? To better answer that question, it's essential to check if the market is valuing the company's shares fairly in terms of its earnings and equity levels.
Enterprise Products Is Currently Under Priced:
Enterprise Products Partners L.P. provides midstream energy services to producers and consumers of natural gas, natural gas liquids (NGLs), crude oil, petrochemicals, and refined products. The company belongs to the Utilities sector, which has an average price to earnings (P/E) ratio of 21.16 and an average price to book (P/B) ratio of 2.36. In contrast, Enterprise Products has a trailing 12 month P/E ratio of 11.5 and a P/B ratio of 2.29.
Enterprise Products has moved 4.4% over the last year compared to 11.8% for the S&P 500 — a difference of -7.4%. Enterprise Products has a 52 week high of $34.63 and a 52 week low of $27.77.
Increasing Revenues but Narrowing Margins:
| 2019 | 2020 | 2021 | 2022 | 2023 | 2024 | |
|---|---|---|---|---|---|---|
| Revenue (M) | $32,789 | $27,200 | $40,807 | $58,186 | $49,715 | $56,219 |
| Operating Margins | 19% | 19% | 15% | 12% | 14% | 13% |
| Net Margins | 14% | 14% | 11% | 9% | 11% | 10% |
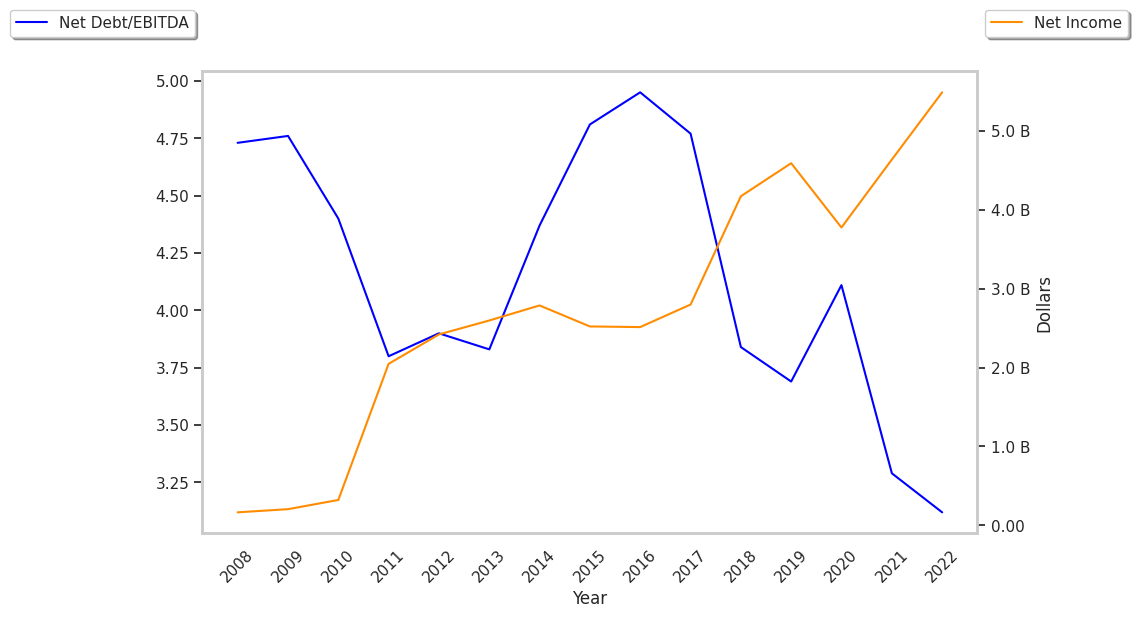
| Net Income (M) | $4,591 | $3,775 | $4,634 | $5,487 | $5,529 | $5,897 |
| Net Interest Expense (M) | $1,243 | $1,287 | $1,283 | $1,244 | $1,269 | $47 |
| Depreciation & Amort. (M) | $1,949 | $2,072 | $151 | $177 | $201 | $1,974 |
| Diluted Shares (M) | 2,202 | 2,202 | 2,203 | 2,199 | 2,194 | 2,192 |
| Earnings Per Share | $2.09 | $1.71 | $2.1 | $2.5 | $2.52 | $2.69 |
| EPS Growth | n/a | -18.18% | 22.81% | 19.05% | 0.8% | 6.75% |
| Avg. Price | $20.7 | $15.22 | $19.63 | $23.14 | $26.35 | $31.26 |
| P/E Ratio | 9.86 | 8.85 | 9.26 | 9.18 | 10.33 | 11.49 |
| Free Cash Flow (M) | $1,989 | $2,603 | $6,290 | $6,075 | $4,303 | $3,571 |
| CAPEX (M) | $4,532 | $3,288 | $2,223 | $1,964 | $3,266 | $4,544 |
| EV / EBITDA | 9.03 | 8.74 | 11.12 | 11.09 | 12.03 | 10.64 |
| Total Debt (M) | $27,625 | $29,866 | $29,535 | $28,295 | $28,748 | $31,896 |
| Net Debt / EBITDA | 3.4 | 4.05 | 4.27 | 3.98 | 4.01 | 3.36 |
| Current Ratio | 0.86 | 1.1 | 1.14 | 0.86 | 0.93 | 1.0 |
Enterprise Products has rapidly growing revenues and increasing reinvestment in the business, generally positive cash flows, and positive EPS growth. However, the firm suffers from weak operating margins with a negative growth trend and not enough current assets to cover current liabilities because its current ratio is 1.0. Finally, we note that Enterprise Products has significant leverage levels.