It's been a great afternoon session for QUALCOMM investors, who saw their shares rise 1.4% to a price of $164.06 per share. At these higher prices, is the company still fairly valued? If you are thinking about investing, make sure to check the company's fundamentals before making a decision.
QUALCOMM Is Fairly Priced to Earnings but Overpriced Compared to Its Book Value:
QUALCOMM Incorporated engages in the development and commercialization of foundational technologies for the wireless industry worldwide. The company belongs to the Technology sector, which has an average price to earnings (P/E) ratio of 30.44 and an average price to book (P/B) ratio of 4.19. In contrast, QUALCOMM has a trailing 12 month P/E ratio of 15.9 and a P/B ratio of 6.54.
QUALCOMM has moved -7.1% over the last year compared to 14.4% for the S&P 500 — a difference of -21.5%. QUALCOMM has a 52 week high of $182.1 and a 52 week low of $120.8.
Strong Revenue Growth and Healthy Leverage Levels:
| 2019 | 2020 | 2021 | 2022 | 2023 | 2024 | |
|---|---|---|---|---|---|---|
| Revenue (M) | $24,273 | $23,531 | $33,566 | $44,200 | $35,820 | $38,962 |
| Operating Margins | 32% | 27% | 28% | 36% | 22% | 26% |
| Net Margins | 18% | 22% | 27% | 28% | 20% | 26% |
| Net Income (M) | $4,386 | $5,198 | $9,043 | $12,936 | $7,232 | $10,142 |
| Net Interest Expense (M) | $627 | $602 | $559 | $490 | $694 | $697 |
| Depreciation & Amort. (M) | $1,401 | $1,393 | $1,582 | $1,762 | $1,809 | $1,400 |
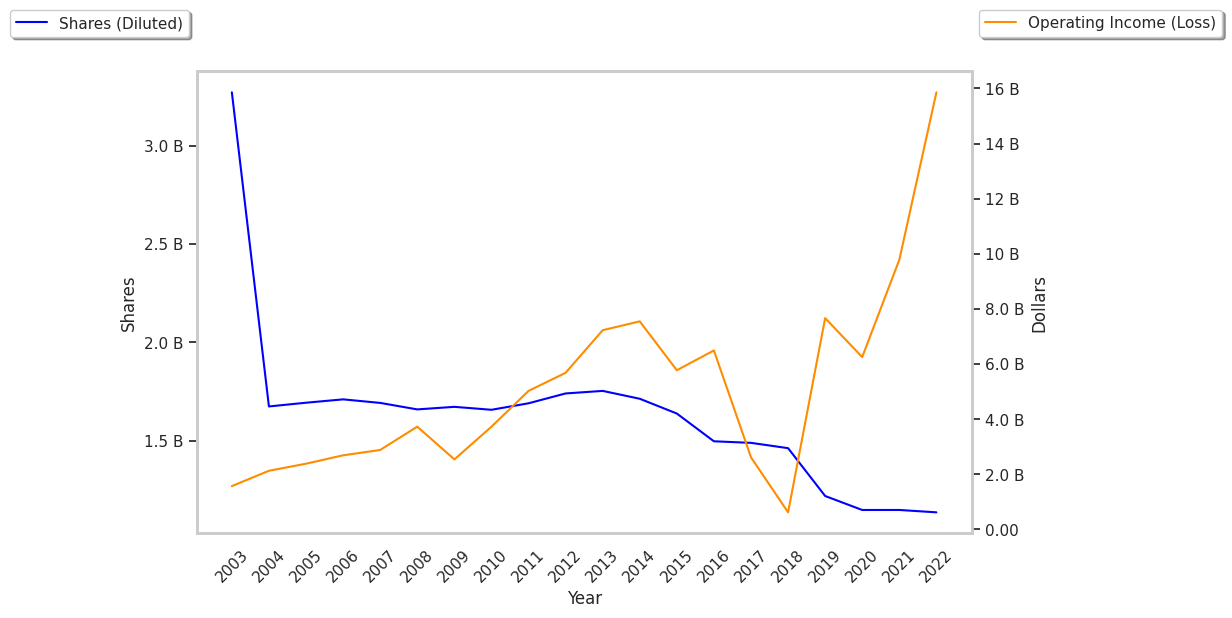
| Diluted Shares (M) | 1,159 | 1,156 | 1,142 | 1,131 | 1,127 | 1,122 |
| Earnings Per Share | $3.59 | $4.52 | $7.87 | $11.37 | $6.42 | $8.97 |
| EPS Growth | n/a | 25.91% | 74.12% | 44.47% | -43.54% | 39.72% |
| Avg. Price | $65.31 | $96.08 | $139.25 | $146.36 | $144.63 | $161.78 |
| P/E Ratio | 17.99 | 20.98 | 17.43 | 12.7 | 22.35 | 17.8 |
| Free Cash Flow (M) | $6,399 | $4,407 | $8,648 | $6,834 | $9,849 | $11,161 |
| CAPEX (M) | $887 | $1,407 | $1,888 | $2,262 | $1,450 | $1,041 |
| EV / EBITDA | 8.76 | 15.34 | 14.52 | 10.0 | 17.54 | 16.18 |
| Total Debt (M) | $15,935 | $15,731 | $15,750 | $16,877 | $15,480 | $14,577 |
| Net Debt / EBITDA | 0.53 | 1.13 | 0.8 | 0.68 | 0.77 | 0.51 |
| Current Ratio | 1.76 | 2.15 | 1.65 | 2.09 | 2.56 | 2.62 |
QUALCOMM has rapidly growing revenues and a flat capital expenditure trend, generally positive cash flows, and an excellent current ratio of 2.62. The company also benefits from strong operating margins with a stable trend, a strong EPS growth trend, and healthy leverage levels.