It's been a great afternoon session for T. Rowe Price investors, who saw their shares rise 1.7% to a price of $107.17 per share. At these higher prices, is the company still fairly valued? If you are thinking about investing, make sure to check the company's fundamentals before making a decision.
T. Rowe Price Shares Are Expensive:
T. Rowe Price Group, Inc. is a publicly owned investment manager. The company belongs to the Finance sector, which has an average price to earnings (P/E) ratio of 15.92 and an average price to book (P/B) ratio of 1.78. In contrast, T. Rowe Price has a trailing 12 month P/E ratio of 12.0 and a P/B ratio of 2.23.
T. Rowe Price has moved -3.7% over the last year compared to 14.4% for the S&P 500 — a difference of -18.2%. T. Rowe Price has a 52 week high of $125.81 and a 52 week low of $77.85.
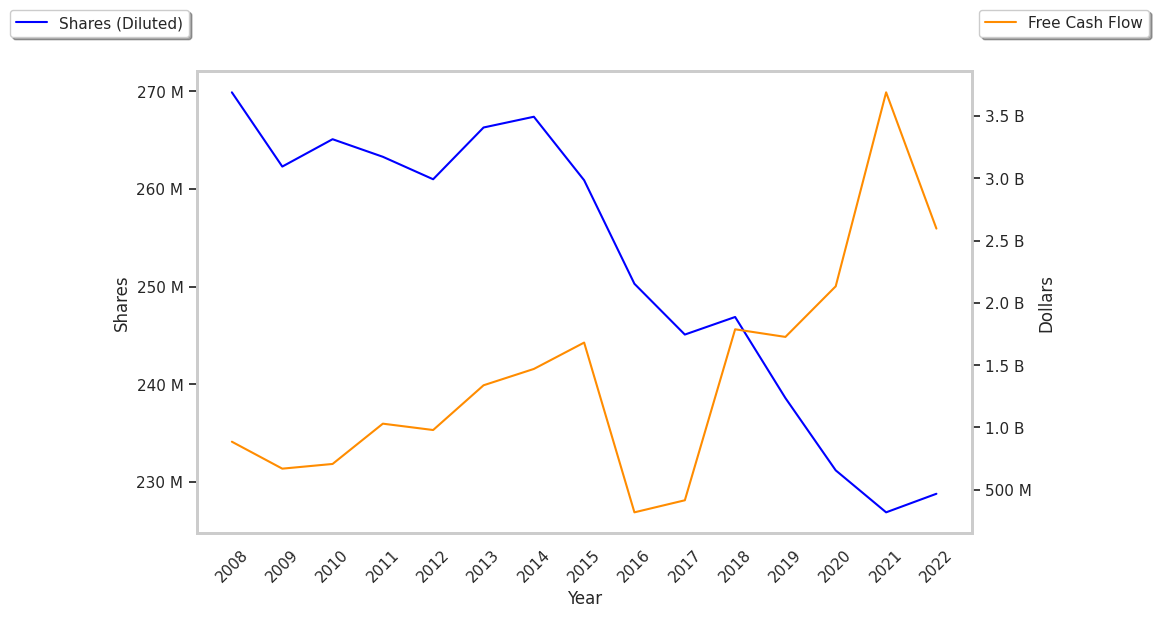
EPS Trend Sustained Primarily by Reducing the Number of Shares Outstanding:
| 2019 | 2020 | 2021 | 2022 | 2023 | 2024 | |
|---|---|---|---|---|---|---|
| Revenue (M) | $5,618 | $6,207 | $7,672 | $6,488 | $6,460 | $7,094 |
| Interest Income (M) | $540 | $496 | $285 | -$426 | $504 | $486 |
| Operating Margins | 42% | 44% | 48% | 37% | 31% | 33% |
| Net Margins | 38% | 38% | 40% | 24% | 28% | 30% |
| Net Income (M) | $2,131 | $2,373 | $3,083 | $1,558 | $1,789 | $2,100 |
| Depreciation & Amort. (M) | $191 | $190 | $205 | $226 | $255 | $254 |
| Diluted Shares (M) | 239 | 231 | 229 | 227 | 225 | 223 |
| Earnings Per Share | $8.7 | $9.98 | $13.12 | $6.7 | $7.76 | $9.15 |
| EPS Growth | n/a | 14.71% | 31.46% | -48.93% | 15.82% | 17.91% |
| Avg. Price | $93.42 | $114.03 | $176.49 | $132.09 | $107.69 | $105.36 |
| P/E Ratio | 10.59 | 11.31 | 13.32 | 19.63 | 13.84 | 11.48 |
| Free Cash Flow (M) | $1,318 | $1,704 | $3,213 | $2,122 | $911 | $1,262 |
| CAPEX (M) | $205 | $215 | $239 | $238 | $308 | $423 |