Today we're going to take a closer look at Large-Cap Utilities company Exelon, whose shares are currently trading at $47.85. We've been asking ourselves whether the company is under or over valued at today's prices... let's perform a brief value analysis to find out!
a Lower P/B Ratio Than Its Sector Average but Its Shares Are Expensive:
Exelon Corporation, a utility services holding company, engages in the energy distribution and transmission businesses. The company belongs to the Utilities sector, which has an average price to earnings (P/E) ratio of 21.16 and an average price to book (P/B) ratio of 2.36. In contrast, Exelon has a trailing 12 month P/E ratio of 18.2 and a P/B ratio of 1.75.
Exelon has moved 15.6% over the last year compared to 13.7% for the S&P 500 — a difference of 1.9%. Exelon has a 52 week high of $48.11 and a 52 week low of $35.94.
The Company May Be Profitable, but Its Balance Sheet Is Highly Leveraged:
| 2019 | 2020 | 2021 | 2022 | 2023 | 2024 | |
|---|---|---|---|---|---|---|
| Revenue (M) | $16,725 | $16,663 | $17,938 | $19,078 | $21,727 | $23,028 |
| Operating Margins | 16% | 13% | 15% | 17% | 19% | 19% |
| Net Margins | 18% | 12% | 10% | 11% | 11% | 11% |
| Net Income (M) | $3,028 | $1,954 | $1,829 | $2,171 | $2,328 | $2,460 |
| Net Interest Expense (M) | $1,591 | $1,610 | $1,264 | $1,422 | $1,704 | $1,889 |
| Depreciation & Amort. (M) | $5,780 | $6,527 | $7,573 | $3,533 | $3,506 | $2,910 |
| Diluted Shares (M) | 974 | 977 | 980 | 987 | 997 | 1,003 |
| Earnings Per Share | $3.01 | $2.01 | $1.74 | $2.2 | $2.34 | $2.45 |
| EPS Growth | n/a | -33.22% | -13.43% | 26.44% | 6.36% | 4.7% |
| Avg. Price | $29.55 | $25.76 | $31.5 | $42.91 | $35.9 | $47.38 |
| P/E Ratio | 9.78 | 12.82 | 18.1 | 25.39 | 20.06 | 25.2 |
| Free Cash Flow (M) | -$589 | -$3,813 | -$4,969 | -$2,277 | -$2,705 | -$1,528 |
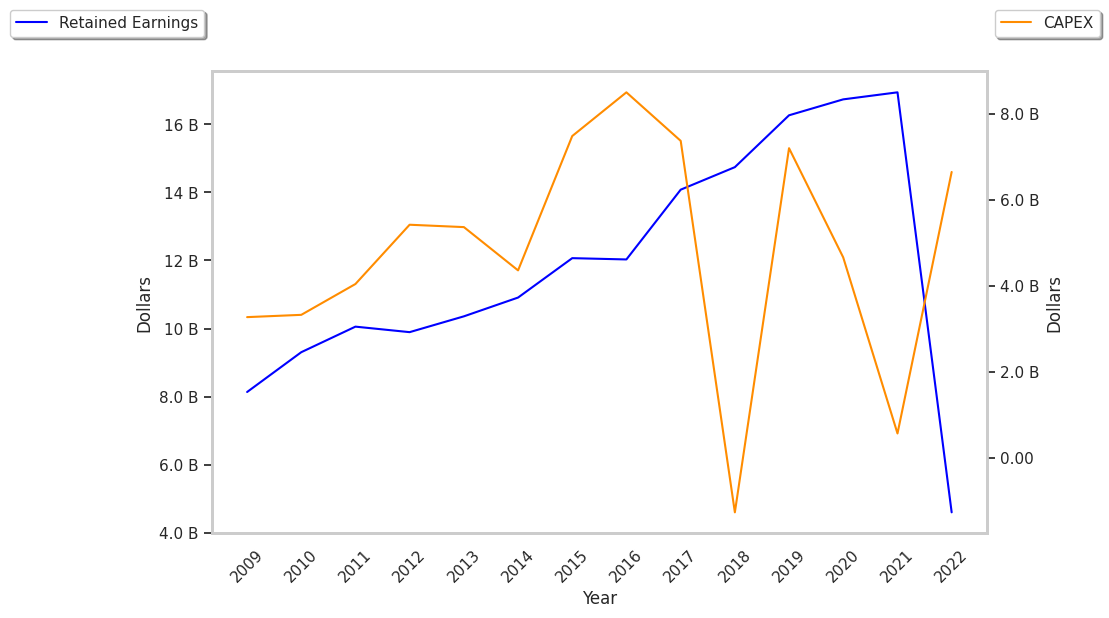
| CAPEX (M) | $7,248 | $8,048 | $7,981 | $7,147 | $7,408 | $7,097 |
| EV / EBITDA | 8.66 | 7.97 | 7.06 | 13.43 | 11.62 | 14.69 |
| Total Debt (M) | $35,950 | $36,906 | $32,655 | $37,169 | $41,279 | $44,668 |
| Net Debt / EBITDA | 4.19 | 4.18 | 3.12 | 5.37 | 5.42 | 6.13 |
| Current Ratio | 0.85 | 0.98 | 0.87 | 0.69 | 0.82 | 0.87 |
Exelon's financial statements include several red flags such as declining EPS growth, negative cash flows, and not enough current assets to cover current liabilities because its current ratio is 0.87. Additionally, the firm has a highly leveraged balance sheet. On the other hand, the company benefits from growing revenues and a flat capital expenditure trend and decent operating margins with a positive growth rate.