Today we're going to take a closer look at Large-Cap Health Care company AbbVie, whose shares are currently trading at $226.49. We've been asking ourselves whether the company is under or over valued at today's prices... let's perform a brief value analysis to find out!
AbbVie's Valuation Is in Line With Its Sector Averages:
AbbVie Inc., a research-based biopharmaceutical company, engages in the research and development, manufacture, commercialization, and sale of medicines and therapies worldwide. The company belongs to the Health Care sector, which has an average price to earnings (P/E) ratio of 22.94. In contrast, AbbVie has a trailing 12 month P/E ratio of 107.9 based on its earnings per share of $2.1.
AbbVie has moved 20.0% over the last year compared to 14.2% for the S&P 500 -- a difference of 5.8%. AbbVie has a 52 week high of $244.81 and a 52 week low of $163.81.
Increasing Revenues but Narrowing Margins:
| 2019 | 2020 | 2021 | 2022 | 2023 | 2024 | |
|---|---|---|---|---|---|---|
| Revenue (M) | $33,266 | $45,804 | $56,197 | $58,054 | $54,318 | $56,334 |
| Operating Margins | 39% | 25% | 32% | 31% | 23% | 16% |
| Net Margins | 24% | 10% | 21% | 20% | 9% | 8% |
| Net Income (M) | $7,882 | $4,616 | $11,542 | $11,836 | $4,863 | $4,278 |
| Net Interest Expense (M) | -$1,509 | -$2,280 | -$2,384 | -$2,044 | -$1,684 | -$2,160 |
| Depreciation & Amort. (M) | $464 | $666 | $803 | $778 | $752 | $764 |
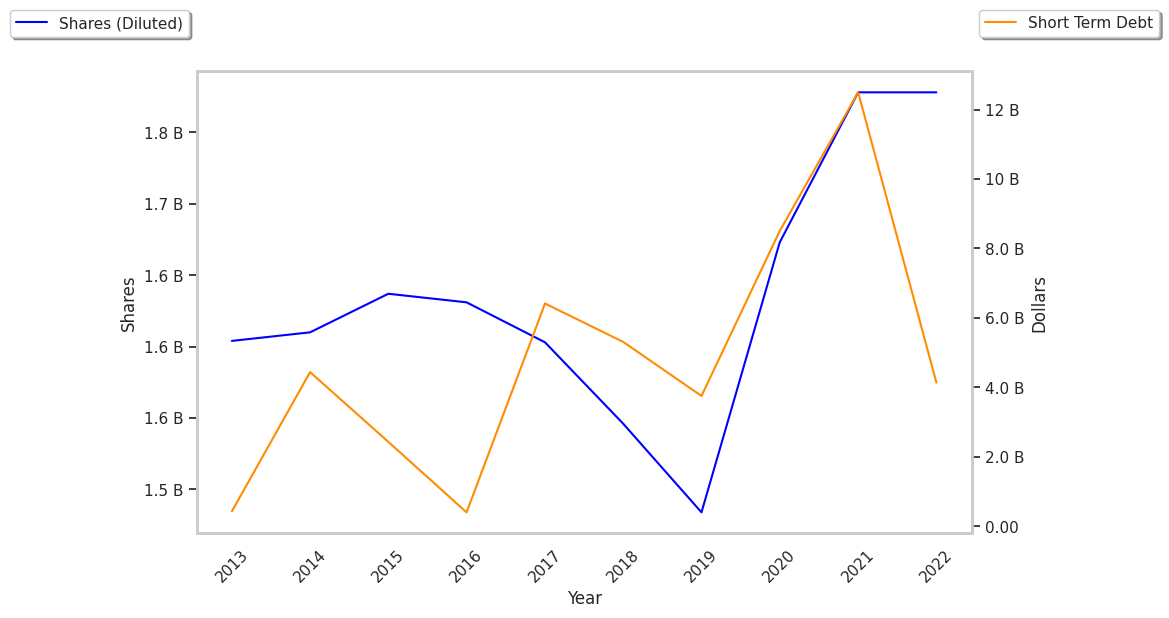
| Diluted Shares (M) | 1,484 | 1,673 | 1,777 | 1,778 | 1,773 | 1,773 |
| Earnings Per Share | $5.28 | $2.72 | $6.45 | $6.63 | $2.72 | $2.39 |
| EPS Growth | n/a | -48.48% | 137.13% | 2.79% | -58.97% | -12.13% |
| Avg. Price | $65.1 | $80.3 | $104.86 | $142.88 | $154.97 | $226.22 |
| P/E Ratio | 12.28 | 29.41 | 16.18 | 21.49 | 56.77 | 94.26 |
| Free Cash Flow (M) | $12,772 | $16,790 | $21,990 | $24,248 | $22,062 | $17,832 |
| CAPEX (M) | $552 | $798 | $787 | $695 | $777 | $974 |
| EV / EBITDA | 9.13 | 16.32 | 13.46 | 16.24 | 23.75 | 47.24 |
| Total Debt (M) | $66,728 | $86,022 | $76,670 | $63,270 | $59,385 | $73,645 |
| Net Debt / EBITDA | 1.99 | 6.45 | 3.57 | 2.86 | 3.45 | 6.88 |
| Current Ratio | 3.18 | 0.84 | 0.79 | 0.96 | 0.87 | 0.66 |
AbbVie has declining EPS growth, not enough current assets to cover current liabilities because its current ratio is 0.66, and a highly leveraged balance sheet. On the other hand, the company benefits from growing revenues and increasing reinvestment in the business and generally positive cash flows. Furthermore, AbbVie has decent operating margins with a negative growth trend.