We've been asking ourselves recently if the market has placed a fair valuation on Advanced Micro Devices. Let's dive into some of the fundamental values of this Large-Cap Technology company to determine if there might be an opportunity here for value-minded investors.
Advanced Micro Devices's Valuation Is in Line With Its Sector Averages:
Advanced Micro Devices, Inc. operates as a semiconductor company worldwide. The company belongs to the Technology sector, which has an average price to earnings (P/E) ratio of 30.44 and an average price to book (P/B) ratio of 4.19. In contrast, Advanced Micro Devices has a trailing 12 month P/E ratio of 138.7 and a P/B ratio of 6.34.
Advanced Micro Devices has moved 47.6% over the last year compared to 13.8% for the S&P 500 — a difference of 33.8%. Advanced Micro Devices has a 52 week high of $241.2 and a 52 week low of $76.48.
Wider Gross Margins Than the Industry Average of 42.19%:
| 2019 | 2020 | 2021 | 2022 | 2023 | 2024 | |
|---|---|---|---|---|---|---|
| Revenue (M) | $6,731 | $9,763 | $16,434 | $23,601 | $22,680 | $25,785 |
| Gross Margins | 43% | 45% | 48% | 45% | 46% | 49% |
| Net Margins | 5% | 26% | 19% | 6% | 4% | 6% |
| Net Income (M) | $341 | $2,490 | $3,162 | $1,320 | $854 | $1,641 |
| Net Interest Expense (M) | $94 | $47 | $34 | -$88 | $106 | $182 |
| Depreciation & Amort. (M) | $222 | $312 | $407 | $626 | $642 | $454 |
| Diluted Shares (M) | 1,188 | 1,226 | 1,229 | 1,571 | 1,625 | 1,637 |
| Earnings Per Share | $0.3 | $2.06 | $2.57 | $1571.0 | $0.53 | $1.0 |
| EPS Growth | n/a | 586.67% | 24.76% | 61028.4% | -99.97% | 88.68% |
| Avg. Price | $29.94 | $65.62 | $101.15 | $105.33 | $147.41 | $234.56 |
| P/E Ratio | 96.58 | 31.25 | 38.75 | 0.07 | 278.13 | 232.24 |
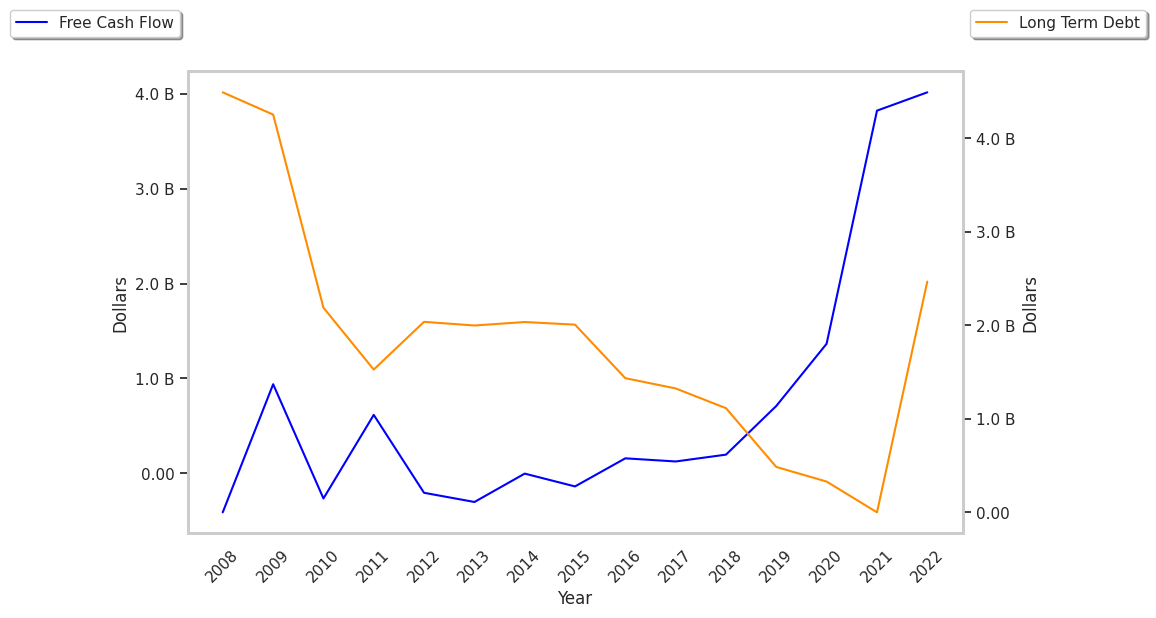
| Free Cash Flow (M) | $276 | $777 | $3,220 | $3,115 | $1,121 | $2,405 |
| CAPEX (M) | $217 | $294 | $301 | $450 | $546 | $636 |
| EV / EBITDA | 34.14 | 44.91 | 29.59 | 69.31 | 227.26 | 160.86 |
| Total Debt (M) | $486 | $330 | $2 | $4,934 | $3,434 | $3,442 |
| Net Debt / EBITDA | -1.15 | -0.75 | -0.62 | 0.05 | -0.48 | -0.15 |
| Current Ratio | 1.95 | 2.54 | 2.02 | 2.36 | 2.51 | 2.62 |
Advanced Micro Devices has rapidly growing revenues and increasing reinvestment in the business, exceptional EPS growth, and generally positive cash flows. The company also benefits from an excellent current ratio of 2.62, wider gross margins than its peer group, and healthy leverage levels.