We've been asking ourselves recently if the market has placed a fair valuation on IQVIA. Let's dive into some of the fundamental values of this Large-Cap Health Care company to determine if there might be an opportunity here for value-minded investors.
IQVIA's Valuation Is in Line With Its Sector Averages:
IQVIA Holdings Inc. provides clinical research services, commercial insights, and healthcare intelligence to the life sciences and healthcare industries in the Americas, Europe, Africa, and the Asia-Pacific. The company belongs to the Health Care sector, which has an average price to earnings (P/E) ratio of 22.94 and an average price to book (P/B) ratio of 3.19. In contrast, IQVIA has a trailing 12 month P/E ratio of 29.7 and a P/B ratio of 6.02.
IQVIA has moved -11.5% over the last year compared to 13.8% for the S&P 500 — a difference of -25.4%. IQVIA has a 52 week high of $235.32 and a 52 week low of $134.65.
Exceptional EPS Growth at the Expense of a Highly Leveraged Balance Sheet:
| 2019 | 2020 | 2021 | 2022 | 2023 | 2024 | |
|---|---|---|---|---|---|---|
| Revenue (M) | $11,088 | $11,359 | $13,874 | $14,410 | $14,984 | $15,405 |
| Operating Margins | 7% | 6% | 10% | 12% | 13% | 14% |
| Net Margins | 2% | 2% | 7% | 8% | 9% | 9% |
| Net Income (M) | $191 | $279 | $966 | $1,091 | $1,358 | $1,373 |
| Net Interest Expense (M) | $447 | $416 | $375 | $416 | $672 | $670 |
| Depreciation & Amort. (M) | $1,202 | $1,287 | $1,264 | $1,130 | $1,125 | $149 |
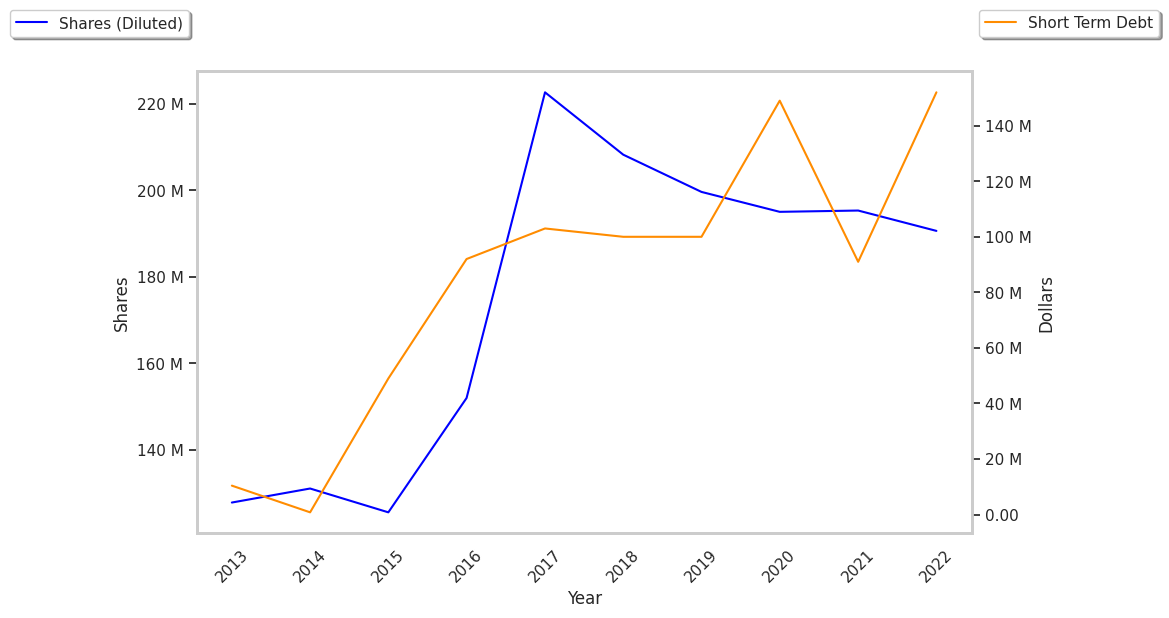
| Diluted Shares (M) | 200 | 195 | 195 | 191 | 186 | 183 |
| Earnings Per Share | $0.96 | $1.43 | $4.95 | $5.72 | $7.29 | $7.49 |
| EPS Growth | n/a | 48.96% | 246.15% | 15.56% | 27.45% | 2.74% |
| Avg. Price | $143.94 | $151.03 | $233.18 | $226.6 | $231.38 | $205.75 |
| P/E Ratio | 146.88 | 103.45 | 46.17 | 38.93 | 31.31 | 27.18 |
| Free Cash Flow (M) | $835 | $1,343 | $2,302 | $1,586 | $1,500 | $2,114 |
| CAPEX (M) | $582 | $616 | $640 | $674 | $649 | $602 |
| EV / EBITDA | 25.62 | 25.77 | 25.33 | 22.92 | 21.76 | 26.08 |
| Total Debt (M) | $23,090 | $24,768 | $24,068 | $25,190 | $25,910 | $25,676 |
| Net Debt / EBITDA | 11.24 | 11.37 | 8.54 | 8.19 | 7.91 | 10.2 |
| Current Ratio | 1.05 | 1.12 | 0.91 | 0.89 | 0.86 | 0.84 |
IQVIA has exceptional EPS growth, generally positive cash flows, and growing revenues and a flat capital expenditure trend. However, the firm suffers from not enough current assets to cover current liabilities because its current ratio is 0.84 and a highly leveraged balance sheet. Finally, we note that IQVIA has weak operating margins with a positive growth rate.