A strong performer from today's afternoon trading session is Cigna, whose shares rose 2.4% to $306.35 per share. For those of you thinking about investing in the stock, here is a brief value analysis of the stock using the company's basic fundamental ratios.
a Lower P/B Ratio Than Its Sector Average but Trading Above Its Fair Price:
The Cigna Group, together with its subsidiaries, provides insurance and related products and services in the United States. The company belongs to the Health Care sector, which has an average price to earnings (P/E) ratio of 22.94 and an average price to book (P/B) ratio of 3.19. In contrast, Cigna has a trailing 12 month P/E ratio of 16.8 and a P/B ratio of 2.03.
Cigna has moved -6.5% over the last year compared to 13.8% for the S&P 500 — a difference of -20.4%. Cigna has a 52 week high of $350.0 and a 52 week low of $256.89.
Generally Positive Cash Flows but Not Enough Current Assets to Cover Current Liabilities:
| 2019 | 2020 | 2021 | 2022 | 2023 | 2024 | |
|---|---|---|---|---|---|---|
| Revenue (M) | $153,566 | $160,401 | $174,069 | $180,518 | $195,265 | $247,121 |
| Operating Margins | 5% | 5% | 5% | 5% | 4% | 4% |
| Net Margins | 3% | 5% | 3% | 4% | 3% | 2% |
| Net Income (M) | $5,120 | $8,489 | $5,420 | $6,782 | $5,372 | $3,778 |
| Net Interest Expense (M) | $1,600 | -$1,438 | -$1,208 | -$1,228 | -$1,446 | $1,500 |
| Depreciation & Amort. (M) | $3,651 | $2,802 | $2,923 | $2,937 | $3,035 | $2,775 |
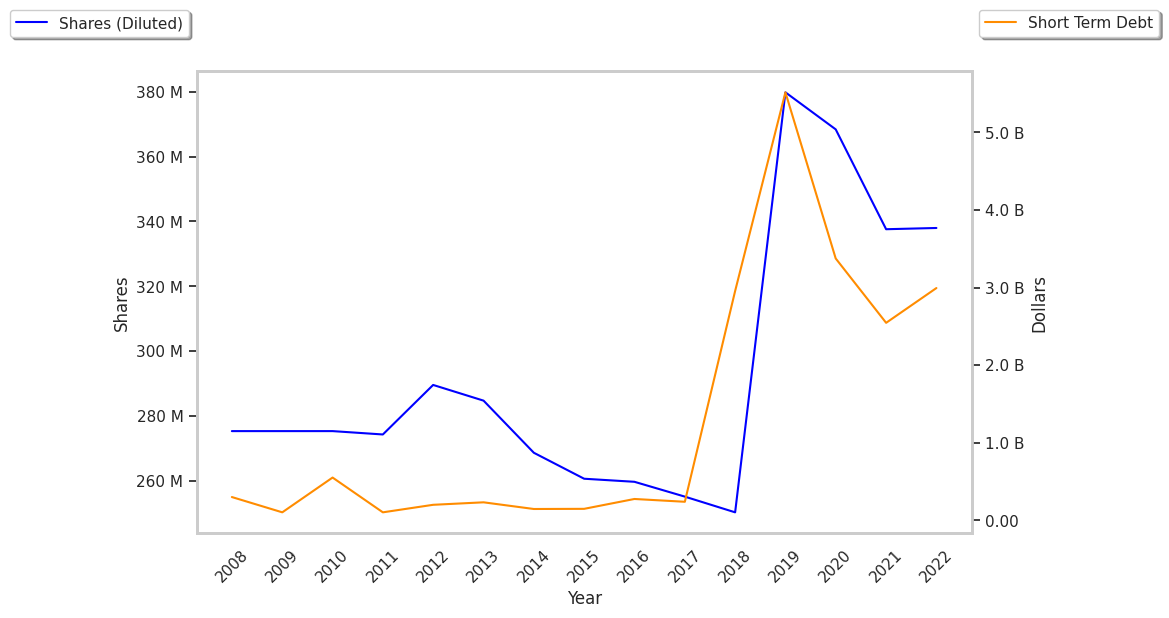
| Diluted Shares (M) | 380 | 368 | 341 | 313 | 297 | 283 |
| Earnings Per Share | $13.44 | $22.96 | $15.75 | $21.41 | $17.39 | $12.12 |
| EPS Growth | n/a | 70.83% | -31.4% | 35.94% | -18.78% | -30.3% |
| Avg. Price | $164.0 | $180.93 | $217.69 | $241.67 | $299.45 | $299.27 |
| P/E Ratio | 12.08 | 7.81 | 13.7 | 11.16 | 17.04 | 24.43 |
| Free Cash Flow (M) | $8,435 | $9,256 | $7,191 | $8,656 | $11,813 | $10,363 |
| EV / EBITDA | 8.11 | 8.16 | 9.68 | 9.02 | 9.68 | 9.18 |
| Total Debt (M) | $37,407 | $32,919 | $33,670 | $31,093 | $30,930 | $31,972 |
| Net Debt / EBITDA | 2.8 | 2.08 | 2.63 | 2.21 | 2.0 | 2.0 |
| Current Ratio | 0.74 | 0.77 | 0.83 | 0.73 | 0.77 | 0.84 |