Now trading at a price of $50.5, Las Vegas Sands has moved 1.5% so far today.
Over the last year, Las Vegas Sands logged a -3.9% change, with its stock price reaching a high of $58.05 and a low of $30.18. Over the same period, the stock underperformed the S&P 500 index by -19.0%. AThe company's 50-day average price was $53.28. Las Vegas Sands Corp., together with its subsidiaries, owns, develops, and operates integrated resorts in Macao and Singapore. Based in Las Vegas, NV, the Large-Cap Consumer Discretionary company has 39,900 full time employees. Las Vegas Sands has offered a 1.9% dividend yield over the last 12 months.
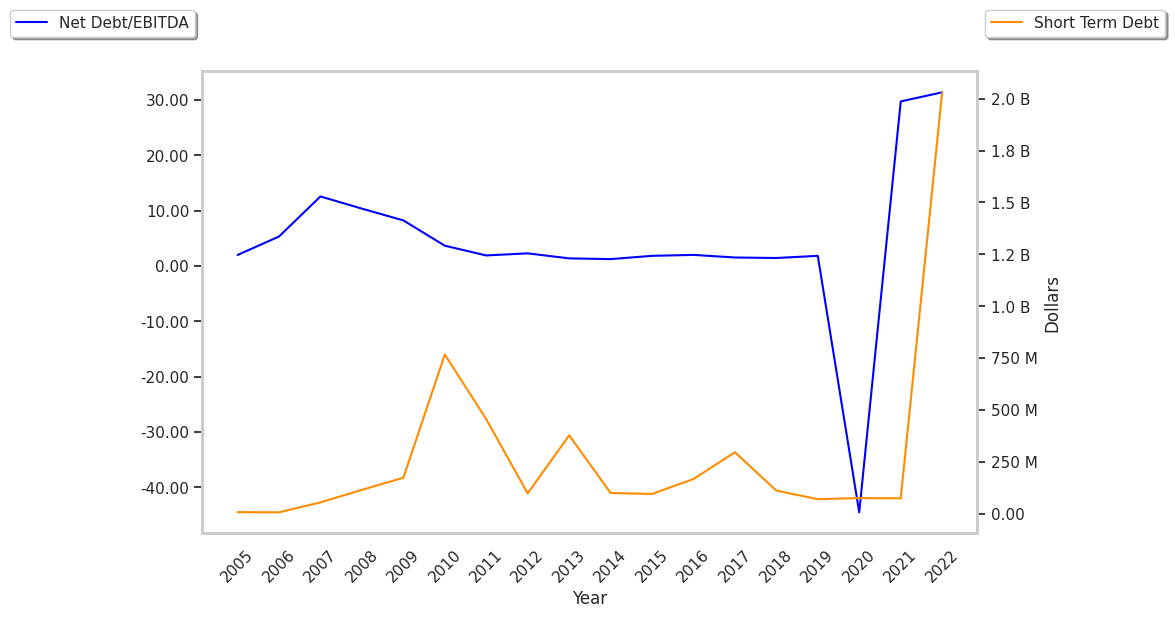
The Company Has a Highly Leveraged Balance Sheet and a Declining EPS Growth Trend:
| 2019 | 2020 | 2021 | 2022 | 2023 | 2024 | |
|---|---|---|---|---|---|---|
| Revenue (M) | $12,127 | $2,940 | $4,234 | $4,110 | $10,372 | $11,298 |
| Operating Margins | 28% | -47% | -16% | -19% | 22% | 21% |
| Net Margins | 22% | -56% | -23% | 45% | 12% | 13% |
| Net Income (M) | $2,698 | -$1,685 | -$961 | $1,832 | $1,221 | $1,446 |
| Net Interest Expense (M) | $449 | $523 | $621 | $702 | $818 | $727 |
| Depreciation & Amort. (M) | $1,020 | $997 | $1,041 | $1,036 | $1,208 | $1,308 |
| Diluted Shares (M) | 771 | 764 | 764 | 764 | 765 | 737 |
| Earnings Per Share | $3.5 | -$2.21 | -$1.26 | $2.4 | $1.6 | $1.96 |
| EPS Growth | n/a | -163.14% | 42.99% | 290.48% | -33.33% | 22.5% |
| Avg. Price | $57.6 | $51.86 | $49.26 | $37.92 | $49.21 | $49.73 |
| P/E Ratio | 16.46 | -23.47 | -39.1 | 15.8 | 30.76 | 25.24 |
| Free Cash Flow (M) | $2,020 | -$2,539 | -$1,071 | -$1,595 | $2,210 | $1,637 |
| CAPEX (M) | $1,018 | $1,227 | $828 | $651 | $1,017 | $1,567 |
| EV / EBITDA | 12.07 | -130.12 | 143.66 | 158.35 | 13.22 | 12.82 |
| Total Debt (M) | $12,492 | $14,005 | $14,795 | $15,978 | $14,029 | $13,752 |
| Net Debt / EBITDA | 1.89 | -30.11 | 36.76 | 39.62 | 2.53 | 2.72 |
| Current Ratio | 1.65 | 2.03 | 2.15 | 1.73 | 1.31 | 0.74 |
Las Vegas Sands has declining EPS growth, not enough current assets to cover current liabilities because its current ratio is 0.74, and a highly leveraged balance sheet. Las Vegas Sands has declining revenues and increasing reinvestment in the business, decent operating margins with a negative growth trend, and positive cash flows.
Las Vegas Sands's Valuation Is in Line With Its Sector Averages:
Las Vegas Sands has a trailing twelve month P/E ratio of 26.9, compared to an average of 20.93 for the Consumer Discretionary sector. Based on its EPS guidance of $2.75, the company has a forward P/E ratio of 19.4. The -3.4% compound average growth rate of Las Vegas Sands's historical and projected earnings per share yields a PEG ratio of -7.95. This indicates that its shares are overvalued.Furthermore, Las Vegas Sands is likely overvalued compared to the book value of its equity, since its P/B ratio of 17.43 is higher than the sector average of 2.93. The company's shares are currently trading 284.3% below their Graham number. Ultimately, Las Vegas Sands's strong cash flows, decent earnings multiple, and healthy debt levels factor towards it being fairly valued, its elevated P/B ratio notwithstanding.
There's an Analyst Consensus of Some Upside Potential for Las Vegas Sands:
The 18 analysts following Las Vegas Sands have set target prices ranging from $55.0 to $73.5 per share, for an average of $60.62 with a buy rating. The company is trading -16.7% away from its average target price, indicating that there is an analyst consensus of some upside potential.
Las Vegas Sands has an average amount of shares sold short because 3.0% of the company's shares are sold short. Institutions own 45.4% of the company's shares, and the insider ownership rate stands at 56.39%, suggesting a large amount of insider shareholders. The largest shareholder is Capital Research Global Investors, whose 7% stake in the company is worth $2,489,335,233.