Today we're going to take a closer look at Large-Cap Real Estate company Realty Income, whose shares are currently trading at $60.22. We've been asking ourselves whether the company is under or over valued at today's prices... let's perform a brief value analysis to find out!
a Lower P/B Ratio Than Its Sector Average but Priced at a Premium:
Realty Income (NYSE: O), an S&P 500 company, is real estate partner to the world's leading companies. The company belongs to the Real Estate sector, which has an average price to earnings (P/E) ratio of 27.31 and an average price to book (P/B) ratio of 1.94. In contrast, Realty Income has a trailing 12 month P/E ratio of 58.5 and a P/B ratio of 1.41.
Realty Income has moved -6.6% over the last year compared to 16.2% for the S&P 500 — a difference of -22.7%. Realty Income has a 52 week high of $64.68 and a 52 week low of $50.71.
Increasing Revenues but Narrowing Margins:
| 2019 | 2020 | 2021 | 2022 | 2023 | 2024 | |
|---|---|---|---|---|---|---|
| Revenue (M) | $1,488 | $1,647 | $2,080 | $3,344 | $4,079 | $5,271 |
| Operating Margins | 30% | 25% | 19% | 27% | 23% | 18% |
| Net Margins | 28% | 24% | 17% | 26% | 21% | 16% |
| Net Income (M) | $436 | $395 | $359 | $869 | $872 | $861 |
| Net Interest Expense (M) | $291 | $309 | $324 | $465 | $730 | $970 |
| Depreciation & Amort. (M) | $594 | $677 | $898 | $1,670 | $1,895 | $2,396 |
| Diluted Shares (M) | 316 | 345 | 415 | 612 | 693 | 864 |
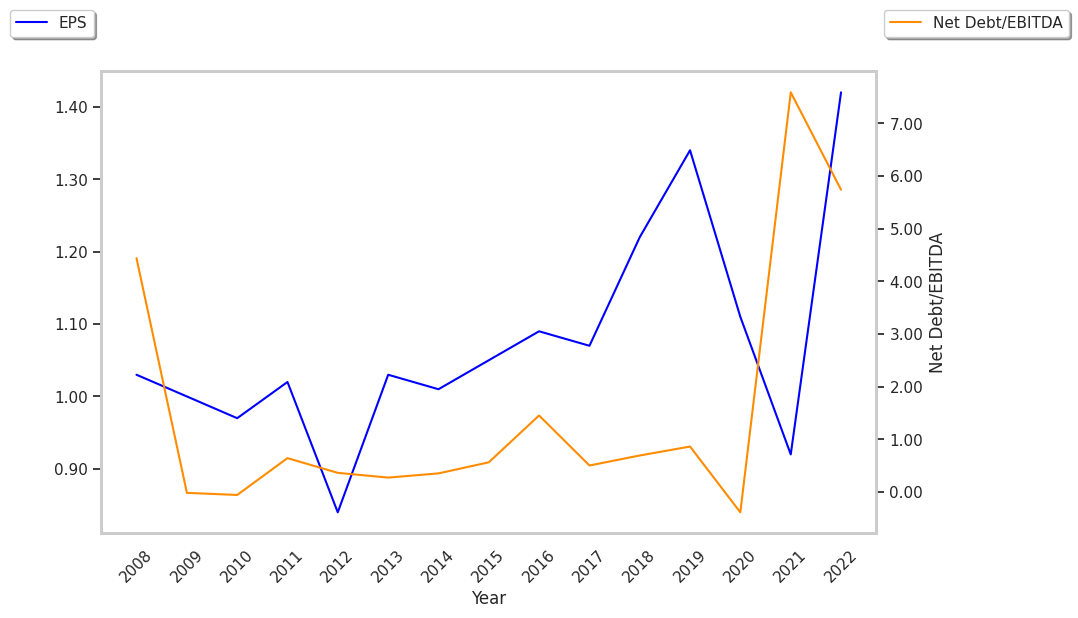
| Earnings Per Share | $1.38 | $1.14 | $0.87 | $1.42 | $1.26 | $0.98 |
| EPS Growth | n/a | -17.39% | -23.68% | 63.22% | -11.27% | -22.22% |
| Avg. Price | $58.52 | $52.53 | $59.73 | $64.45 | $57.42 | $60.03 |
| P/E Ratio | 42.41 | 45.68 | 68.66 | 45.39 | 45.57 | 61.26 |
| Free Cash Flow (M) | $1,045 | $1,107 | $1,303 | $2,468 | $2,890 | $3,452 |
| CAPEX (M) | $24 | $9 | $19 | $96 | $69 | $121 |
| EV / EBITDA | 23.62 | 23.17 | 26.97 | 20.27 | 20.41 | 22.91 |
| Total Debt (M) | $6,787 | $8,517 | $12,749 | $14,528 | $19,934 | $25,016 |
| Net Debt / EBITDA | 6.49 | 7.07 | 9.68 | 5.55 | 6.98 | 7.38 |
Realty Income has weak operating margins with a negative growth trend, declining EPS growth, and a highly leveraged balance sheet. On the other hand, the company benefits from rapidly growing revenues and increasing reinvestment in the business and generally positive cash flows.