Today we're going to take a closer look at Large-Cap Utilities company Kinder Morgan, whose shares are currently trading at $26.41. We've been asking ourselves whether the company is under or over valued at today's prices... let's perform a brief value analysis to find out!
Kinder Morgan's Valuation Is in Line With Its Sector Averages:
Kinder Morgan, Inc. operates as an energy infrastructure company primarily in North America. The company belongs to the Utilities sector, which has an average price to earnings (P/E) ratio of 21.16 and an average price to book (P/B) ratio of 2.36. In contrast, Kinder Morgan has a trailing 12 month P/E ratio of 21.6 and a P/B ratio of 1.91.
Kinder Morgan has moved 5.2% over the last year compared to 16.0% for the S&P 500 — a difference of -10.8%. Kinder Morgan has a 52 week high of $31.48 and a 52 week low of $23.94.
Increasing Revenues but Narrowing Margins:
| 2019 | 2020 | 2021 | 2022 | 2023 | 2024 | |
|---|---|---|---|---|---|---|
| Revenue (M) | $13,209 | $11,700 | $16,610 | $19,200 | $15,334 | $15,100 |
| Operating Margins | 37% | 13% | 18% | 21% | 28% | 28% |
| Net Margins | 17% | 1% | 11% | 13% | 16% | 17% |
| Net Income (M) | $2,190 | $119 | $1,784 | $2,548 | $2,391 | $2,613 |
| Net Interest Expense (M) | -$1,801 | -$1,595 | -$1,492 | -$1,513 | -$1,797 | -$1,844 |
| Depreciation & Amort. (M) | $2,411 | $2,164 | $2,135 | $2,186 | $2,250 | $2,354 |
| Diluted Shares (M) | 2,264 | 2,263 | 2,266 | 2,258 | 2,234 | 2,220 |
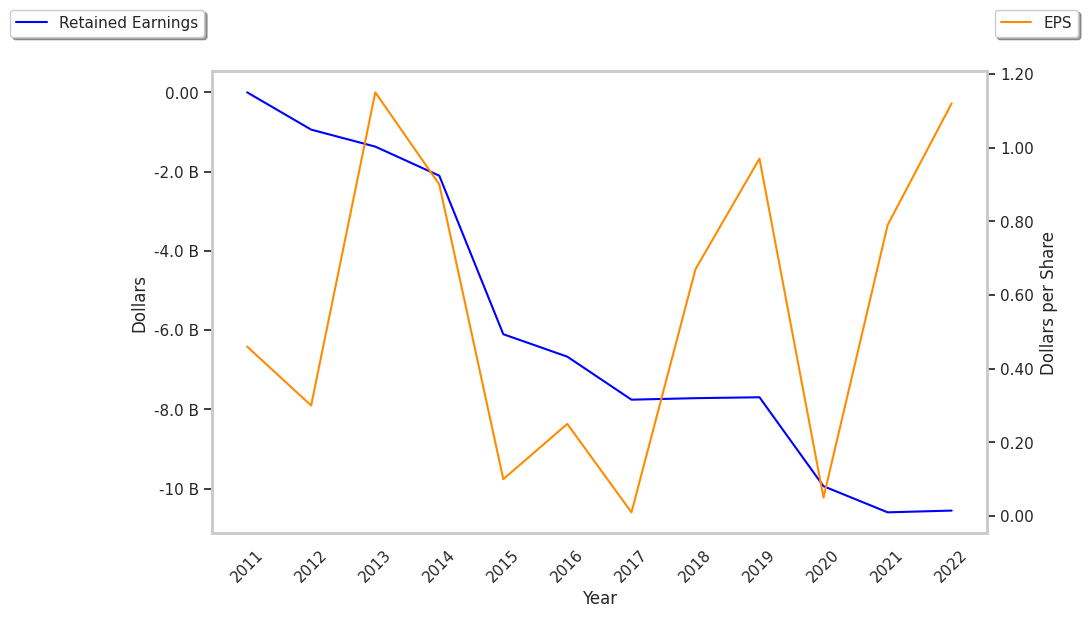
| Earnings Per Share | $0.96 | $0.05 | $0.78 | $1.12 | $1.06 | $1.17 |
| EPS Growth | n/a | -94.79% | 1460.0% | 43.59% | -5.36% | 10.38% |
| Avg. Price | $15.51 | $12.62 | $14.79 | $16.82 | $17.64 | $26.25 |
| P/E Ratio | 16.16 | 252.4 | 18.96 | 15.02 | 16.64 | 22.44 |
| Free Cash Flow (M) | $2,478 | $2,843 | $4,427 | $3,346 | $4,174 | $3,006 |
| CAPEX (M) | $2,270 | $1,707 | $1,281 | $1,621 | $2,317 | $2,629 |
| EV / EBITDA | 9.52 | 16.67 | 13.0 | 11.07 | 11.01 | 13.37 |
| Total Debt (M) | $34,392 | $34,689 | $33,320 | $31,788 | $32,116 | $31,890 |
| Net Debt / EBITDA | 4.7 | 9.0 | 6.37 | 4.97 | 4.92 | 4.72 |
| Current Ratio | 0.63 | 0.63 | 0.66 | 0.55 | 0.35 | 0.49 |
Kinder Morgan has growing revenues and increasing reinvestment in the business, positive EPS growth, and generally positive cash flows. However, the firm suffers from not enough current assets to cover current liabilities because its current ratio is 0.49 and a highly leveraged balance sheet. Finally, we note that Kinder Morgan has decent operating margins with a negative growth trend.