It hasn't been a great afternoon session for Union Pacific investors, who have watched their shares sink by -1.2% to a price of $217.33. Some of you might be wondering if it's time to buy the dip. If you are considering this, make sure to check the company's fundamentals first to determine if the shares are fairly valued at today's prices.
a Very Low P/E Ratio but Its Shares Are Expensive:
Union Pacific Corporation, through its subsidiary, Union Pacific Railroad Company, operates in the railroad business in the United States. The company belongs to the Industrials sector, which has an average price to earnings (P/E) ratio of 24.03 and an average price to book (P/B) ratio of 2.89. In contrast, Union Pacific has a trailing 12 month P/E ratio of 18.5 and a P/B ratio of 7.44.
Union Pacific has moved -4.5% over the last year compared to 16.0% for the S&P 500 -- a difference of -20.5%. Union Pacific has a 52 week high of $256.84 and a 52 week low of $204.66.
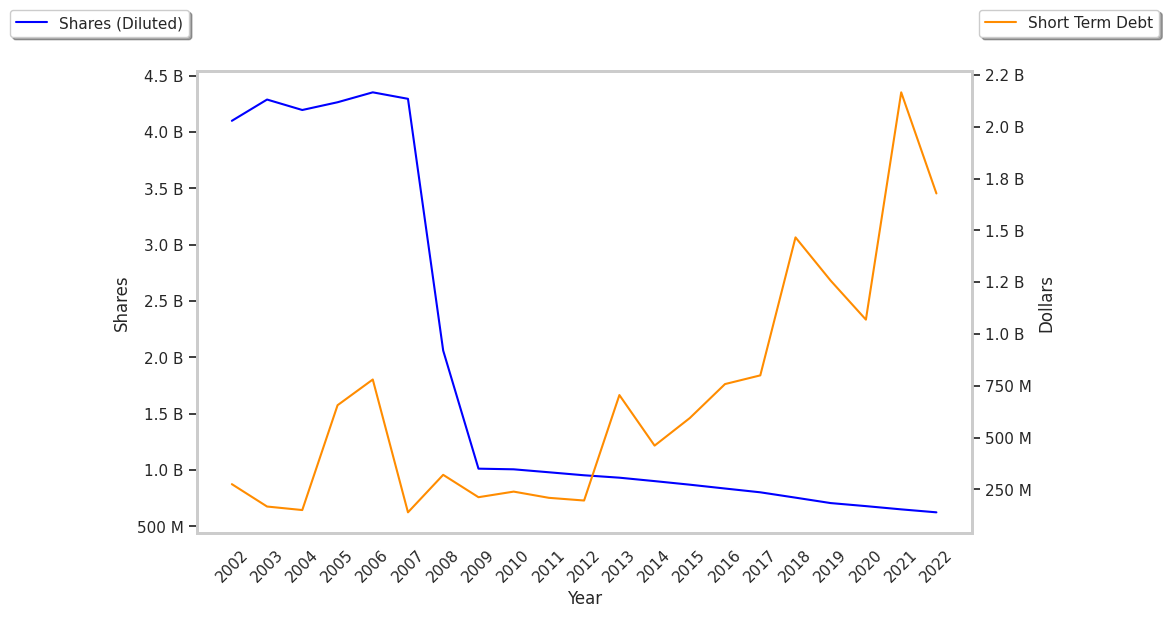
EPS Trend Sustained Primarily by Reducing the Number of Shares Outstanding:
| 2019 | 2020 | 2021 | 2022 | 2023 | 2024 | |
|---|---|---|---|---|---|---|
| Revenue (M) | $21,708 | $19,533 | $21,804 | $24,875 | $24,119 | $24,250 |
| Operating Margins | 39% | 40% | 43% | 40% | 38% | 40% |
| Net Margins | 27% | 27% | 30% | 28% | 26% | 28% |
| Net Income (M) | $5,919 | $5,349 | $6,523 | $6,998 | $6,379 | $6,747 |
| Net Interest Expense (M) | $1,050 | $1,141 | $1,157 | $1,271 | $1,340 | $1,260 |
| Depreciation & Amort. (M) | $2,216 | $2,210 | $2,208 | $2,246 | $2,318 | $2,398 |
| Diluted Shares (M) | 706 | 679 | 655 | 624 | 610 | 609 |
| Earnings Per Share | $8.38 | $7.88 | $9.95 | $11.21 | $10.45 | $11.09 |
| EPS Growth | n/a | -5.97% | 26.27% | 12.66% | -6.78% | 6.12% |
| Avg. Price | $153.91 | $166.81 | $211.64 | $231.67 | $245.62 | $220.04 |
| P/E Ratio | 18.79 | 21.52 | 21.73 | 21.08 | 23.55 | 19.9 |
| Free Cash Flow (M) | $5,156 | $5,613 | $6,096 | $5,742 | $4,773 | $5,894 |
| CAPEX (M) | $3,453 | $2,927 | $2,936 | $3,620 | $3,606 | $3,452 |
| EV / EBITDA | 12.59 | 13.95 | 14.77 | 14.79 | 15.95 | 13.57 |
| Total Debt (M) | $25,200 | $26,729 | $29,729 | $33,326 | $32,579 | $31,192 |
| Net Debt / EBITDA | 2.26 | 2.48 | 2.49 | 2.66 | 2.77 | 2.49 |
| Current Ratio | 0.79 | 1.01 | 0.62 | 0.72 | 0.81 | 0.77 |
Union Pacific has strong operating margins with a stable trend and growing revenues and a flat capital expenditure trend. Additionally, the company's financial statements display generally positive cash flows and healthy leverage levels. However, the firm suffers from EPS growth achieved by reducing the number of outstanding shares and not enough current assets to cover current liabilities because its current ratio is 0.77.