Now trading at a price of $38.79, Verizon Communications has moved 1.0% so far today.
Verizon Communications returned losses of -7.2% last year, with its stock price reaching a high of $47.36 and a low of $37.59. Over the same period, the stock underperformed the S&P 500 index by -23.2%. AThe company's 50-day average price was $42.93. Verizon Communications Inc., through its subsidiaries, engages in the provision of communications, technology, information, and entertainment products and services to consumers, businesses, and governmental entities worldwide. Based in New York, NY, the Large-Cap Telecommunications company has 100,000 full time employees. Verizon Communications has offered a 7.1% dividend yield over the last 12 months.
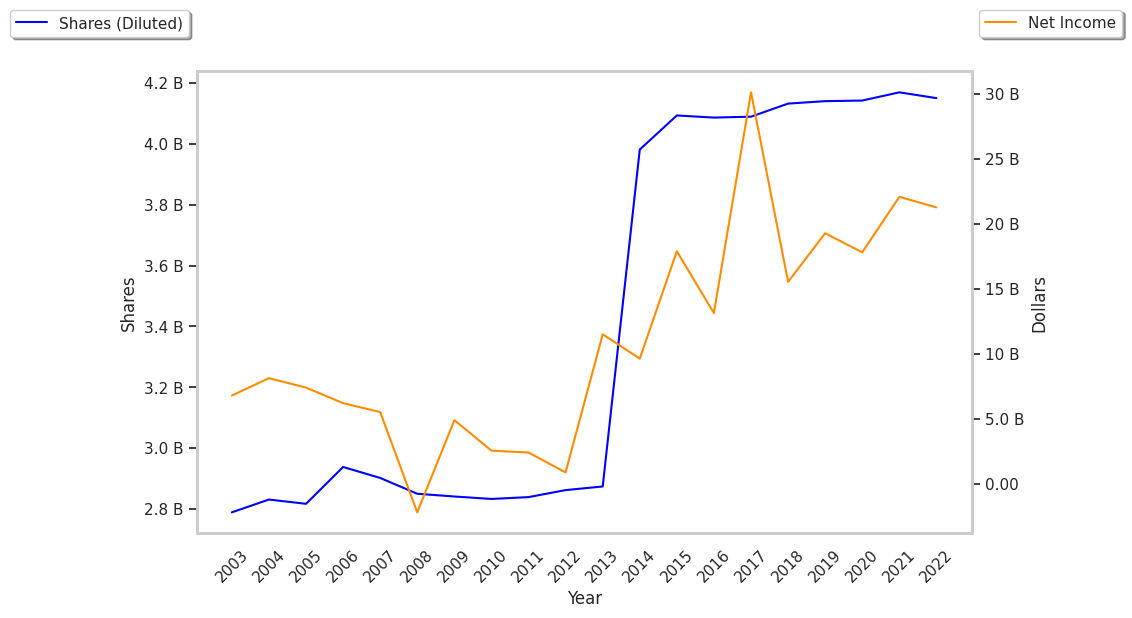
The Company's Revenues Are Declining:
| 2019 | 2020 | 2021 | 2022 | 2023 | 2024 | |
|---|---|---|---|---|---|---|
| Revenue (M) | $131,868 | $128,292 | $133,613 | $136,835 | $133,974 | $134,788 |
| Operating Margins | 23% | 22% | 24% | 22% | 17% | 21% |
| Net Margins | 15% | 14% | 17% | 16% | 9% | 13% |
| Net Income (M) | $19,265 | $17,801 | $22,065 | $21,256 | $11,614 | $17,506 |
| Net Interest Expense (M) | $4,730 | $4,247 | $3,485 | $3,613 | $5,524 | $336 |
| Depreciation & Amort. (M) | $16,682 | $16,720 | $16,206 | $17,099 | $17,624 | $15,112 |
| Diluted Shares (M) | 4,140 | 4,142 | 4,150 | 4,204 | 4,215 | 4,223 |
| Earnings Per Share | $4.65 | $4.3 | $5.32 | $5.06 | $2.75 | $4.14 |
| EPS Growth | n/a | -7.53% | 23.72% | -4.89% | -45.65% | 50.55% |
| Avg. Price | $47.21 | $48.98 | $48.98 | $47.48 | $37.7 | $38.4 |
| P/E Ratio | 10.13 | 11.39 | 9.21 | 9.38 | 13.66 | 9.25 |
| Free Cash Flow (M) | $17,807 | $23,576 | $19,253 | $14,054 | $18,708 | $33,612 |
| CAPEX (M) | $17,939 | $18,192 | $20,286 | $23,087 | $18,767 | $3,300 |
| EV / EBITDA | 6.46 | 6.67 | 7.05 | 7.09 | 7.26 | 6.36 |
| Total Debt (M) | $111,489 | $123,173 | $143,425 | $140,676 | $137,701 | $121,381 |
| Net Debt / EBITDA | 2.31 | 2.22 | 2.89 | 2.9 | 3.35 | 2.68 |
| Current Ratio | 0.84 | 1.38 | 0.78 | 0.75 | 0.69 | 0.63 |
Verizon Communications Shares Are Inexpensive:
Verizon Communications has a trailing twelve month P/E ratio of 10.0, compared to an average of 18.22 for the Telecommunications sector. Based on its EPS guidance of $4.73, the company has a forward P/E ratio of 9.1. The 0.2% compound average growth rate of Verizon Communications's historical and projected earnings per share yields a PEG ratio of 40.92. This suggests that these shares are overvalued. In contrast, the market is likely undervaluing Verizon Communications in terms of its equity because its P/B ratio is 1.59 while the sector average is 1.86. The company's shares are currently trading -17.6% above their Graham number.
Verizon Communications Has an Average Rating of Buy:
The 21 analysts following Verizon Communications have set target prices ranging from $43.0 to $58.0 per share, for an average of $48.86 with a buy rating. The company is trading -20.6% away from its average target price, indicating that there is an analyst consensus of strong upside potential.
Verizon Communications has an average amount of shares sold short because 2.1% of the company's shares are sold short. Institutions own 68.0% of the company's shares, and the insider ownership rate stands at 0.04%, suggesting a small amount of insider investors. The largest shareholder is Vanguard Group Inc, whose 9% stake in the company is worth $14,463,464,719.