Today we're going to take a closer look at Large-Cap Technology company Cadence Design Systems, whose shares are currently trading at $339.9. We've been asking ourselves whether the company is under or over valued at today's prices... let's perform a brief value analysis to find out!
Cadence Design Systems's Valuation Is in Line With Its Sector Averages:
Cadence Design Systems, Inc. provides software, hardware, and other services worldwide. The company belongs to the Technology sector, which has an average price to earnings (P/E) ratio of 30.44 and an average price to book (P/B) ratio of 4.19. In contrast, Cadence Design Systems has a trailing 12 month P/E ratio of 87.4 and a P/B ratio of 17.73.
Cadence Design Systems has moved 17.7% over the last year compared to 18.5% for the S&P 500 — a difference of -0.8%. Cadence Design Systems has a 52 week high of $376.45 and a 52 week low of $221.56.
Strong Revenue Growth and Healthy Leverage Levels:
| 2018 | 2019 | 2021 | 2022 | 2023 | 2024 | |
|---|---|---|---|---|---|---|
| Revenue (M) | $2,138 | $2,336 | $2,683 | $2,988 | $4,090 | $4,641 |
| Operating Margins | 19% | 21% | 24% | 26% | 31% | 28% |
| Net Margins | 16% | 42% | 22% | 23% | 25% | 23% |
| Net Income (M) | $346 | $989 | $591 | $696 | $1,041 | $1,055 |
| Net Interest Expense (M) | $23 | $19 | $21 | $17 | $36 | $76 |
| Depreciation & Amort. (M) | $119 | $123 | $146 | $142 | $145 | $97 |
| Diluted Shares (M) | 281 | 281 | 278 | 275 | 273 | 274 |
| Earnings Per Share | $1.23 | $3.53 | $2.11 | $2.5 | $3.82 | $3.85 |
| EPS Growth | n/a | 186.99% | -40.23% | 18.48% | 52.8% | 0.79% |
| Avg. Price | $42.72 | $64.43 | $148.58 | $152.33 | $272.37 | $341.3 |
| P/E Ratio | 33.9 | 17.8 | 68.79 | 59.97 | 70.56 | 87.74 |
| Free Cash Flow (M) | $543 | $655 | $810 | $1,036 | $1,247 | $1,118 |
| CAPEX (M) | $62 | $75 | $95 | $65 | $102 | $143 |
| EV / EBITDA | 23.1 | 28.81 | 51.55 | 45.27 | 52.98 | 64.07 |
| Total Debt (M) | $345 | $346 | $347 | $348 | $649 | $2,476 |
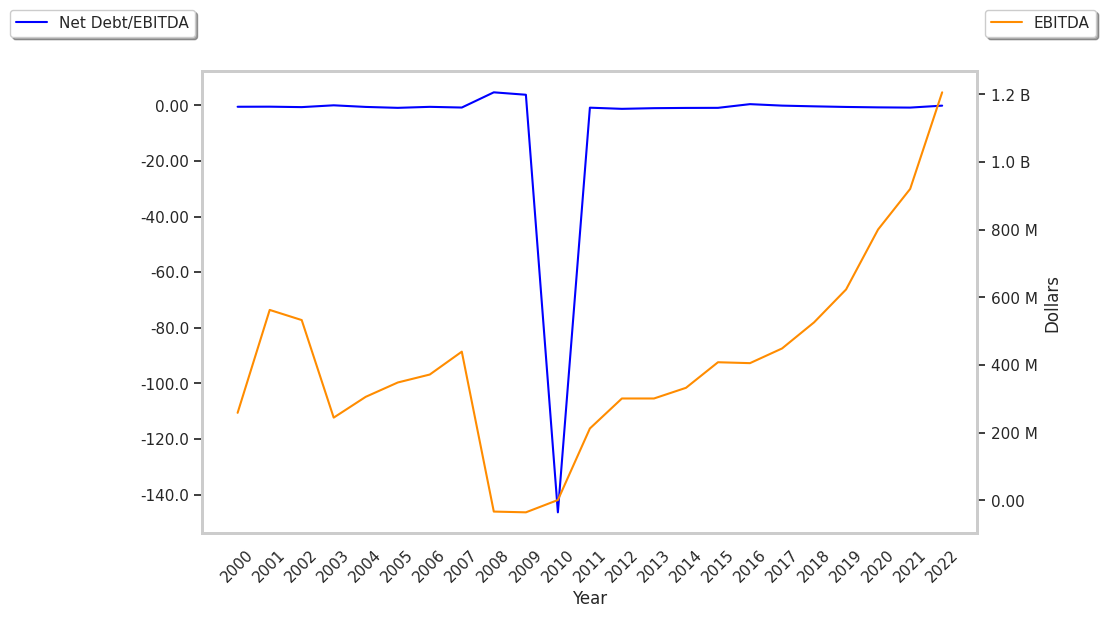
| Net Debt / EBITDA | -0.37 | -0.58 | -0.84 | -0.58 | -0.26 | -0.12 |
| Current Ratio | 1.34 | 1.74 | 1.7 | 1.27 | 1.24 | 2.93 |
Cadence Design Systems has rapidly growing revenues and increasing reinvestment in the business, strong operating margins with a positive growth rate, and exceptional EPS growth. The company also benefits from generally positive cash flows, an excellent current ratio of 2.93, and healthy leverage levels.