Exelon shares fell by -1.3% during the day's morning session, and are now trading at a price of $45.51. Is it time to buy the dip? To better answer that question, it's essential to check if the market is valuing the company's shares fairly in terms of its earnings and equity levels.
a Lower P/B Ratio Than Its Sector Average but Priced at a Premium:
Exelon Corporation, a utility services holding company, engages in the energy distribution and transmission businesses. The company belongs to the Utilities sector, which has an average price to earnings (P/E) ratio of 21.16 and an average price to book (P/B) ratio of 2.36. In contrast, Exelon has a trailing 12 month P/E ratio of 17.3 and a P/B ratio of 1.66.
Exelon has moved 21.5% over the last year compared to 19.7% for the S&P 500 -- a difference of 1.7%. Exelon has a 52 week high of $48.51 and a 52 week low of $35.94.
The Company May Be Profitable, but Its Balance Sheet Is Highly Leveraged:
| 2019 | 2020 | 2021 | 2022 | 2023 | 2024 | |
|---|---|---|---|---|---|---|
| Revenue (M) | $16,725 | $16,663 | $17,938 | $19,078 | $21,727 | $23,028 |
| Operating Margins | 16% | 13% | 15% | 17% | 19% | 19% |
| Net Margins | 18% | 12% | 10% | 11% | 11% | 11% |
| Net Income (M) | $3,028 | $1,954 | $1,829 | $2,171 | $2,328 | $2,460 |
| Net Interest Expense (M) | $1,591 | $1,610 | $1,264 | $1,422 | $1,704 | $1,889 |
| Depreciation & Amort. (M) | $5,780 | $6,527 | $7,573 | $3,533 | $3,506 | $2,910 |
| Diluted Shares (M) | 974 | 977 | 980 | 987 | 997 | 1,003 |
| Earnings Per Share | $3.01 | $2.01 | $1.74 | $2.2 | $2.34 | $2.45 |
| EPS Growth | n/a | -33.22% | -13.43% | 26.44% | 6.36% | 4.7% |
| Avg. Price | $29.55 | $25.76 | $31.5 | $42.91 | $35.9 | $46.12 |
| P/E Ratio | 9.78 | 12.82 | 18.1 | 25.39 | 20.06 | 24.53 |
| Free Cash Flow (M) | -$589 | -$3,813 | -$4,969 | -$2,277 | -$2,705 | -$1,528 |
| CAPEX (M) | $7,248 | $8,048 | $7,981 | $7,147 | $7,408 | $7,097 |
| EV / EBITDA | 8.66 | 7.97 | 7.06 | 13.43 | 11.62 | 14.46 |
| Total Debt (M) | $35,950 | $36,906 | $32,655 | $37,169 | $41,279 | $44,668 |
| Net Debt / EBITDA | 4.19 | 4.18 | 3.12 | 5.37 | 5.42 | 6.13 |
| Current Ratio | 0.85 | 0.98 | 0.87 | 0.69 | 0.82 | 0.87 |
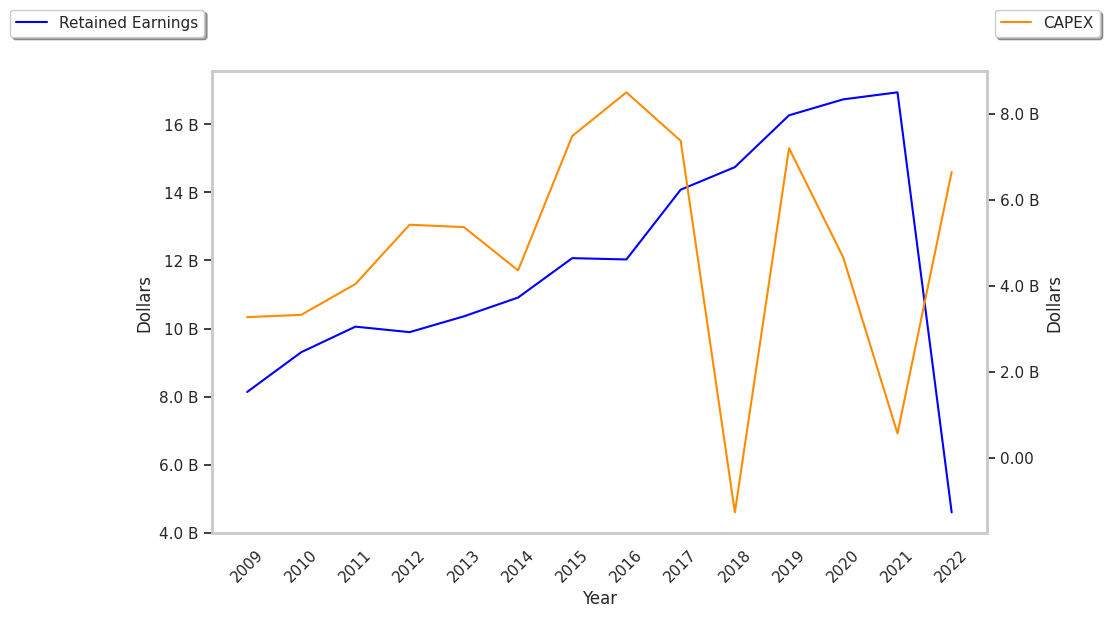
Exelon's financial statements include several red flags such as declining EPS growth, negative cash flows, and not enough current assets to cover current liabilities because its current ratio is 0.87. Additionally, the firm has a highly leveraged balance sheet. On the other hand, the company benefits from growing revenues and a flat capital expenditure trend and decent operating margins with a positive growth rate.