Now trading at a price of $37.39, Exelixis has moved -3.3% so far today.
Exelixis returned gains of 12.8% last year, with its stock price reaching a high of $49.62 and a low of $31.9. Over the same period, the stock underperformed the S&P 500 index by -7.0%. The company's 50-day average price was $38.83. Exelixis, Inc., an oncology company, focuses on the discovery, development, and commercialization of new medicines for difficult-to-treat cancers in the United States. Based in Alameda, CA, the Large-Cap Health Care company has 1,147 full time employees. Exelixis has not offered a dividend during the last year.
Increasing Revenues but Narrowing Margins:
| 2017 | 2019 | 2020 | 2021 | 2022 | 2024 | |
|---|---|---|---|---|---|---|
| Revenue (M) | $854 | $968 | $988 | $1,611 | $1,830 | $2,169 |
| Operating Margins | 51% | 38% | 11% | 13% | 9% | 28% |
| Net Margins | 81% | 33% | 11% | 11% | 11% | 24% |
| Net Income (M) | $690 | $321 | $112 | $182 | $208 | $521 |
| Net Interest Expense (M) | n/a | $28 | $20 | $33 | $87 | $77 |
| Depreciation & Amort. (M) | $8 | $8 | $9 | $21 | $26 | $29 |
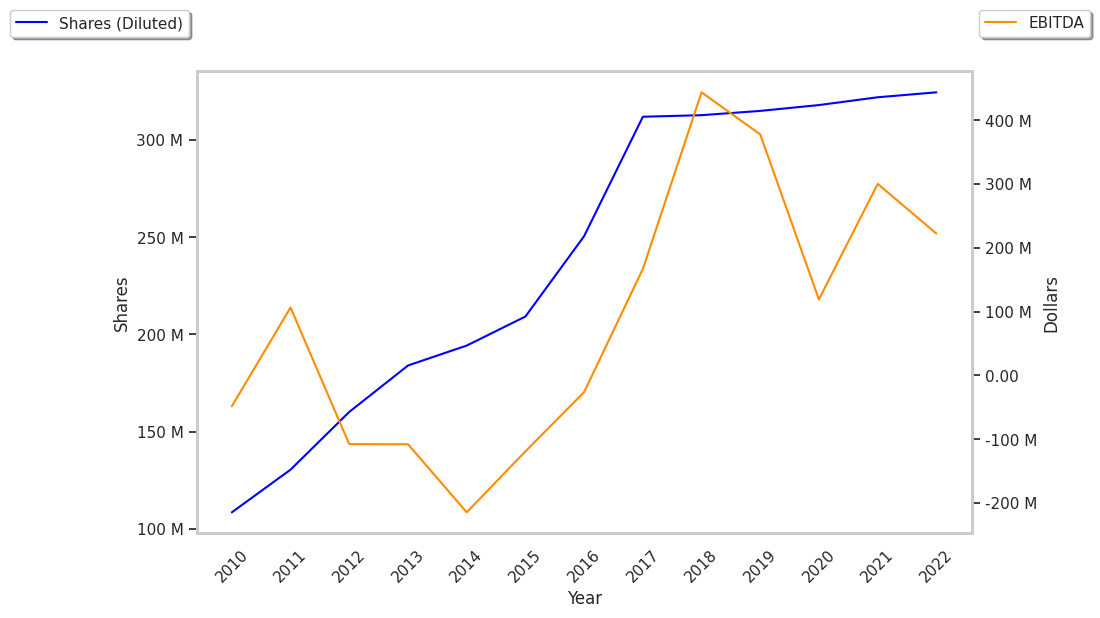
| Diluted Shares (M) | 313 | 309 | 322 | 325 | 321 | 288 |
| Earnings Per Share | $2.21 | $1.02 | $0.35 | $0.56 | $0.65 | $1.76 |
| EPS Growth | n/a | -53.85% | -65.69% | 60.0% | 16.07% | 170.77% |
| Avg. Price | $26.66 | $20.2 | $21.45 | $20.87 | $20.14 | $37.51 |
| P/E Ratio | 11.49 | 19.06 | 59.58 | 36.61 | 30.98 | 20.84 |
| Free Cash Flow (M) | $663 | $514 | $179 | $335 | $293 | $672 |
| CAPEX (M) | $64 | $13 | $30 | $28 | $40 | $28 |
| Current Ratio | 8.5 | 6.99 | 5.43 | 4.99 | 3.34 | 3.5 |
Exelixis has an excellent current ratio of 3.5, rapidly growing revenues and decreasing reinvestment in the business, and generally positive cash flows. However, the firm has declining EPS growth. Finally, we note that Exelixis has decent operating margins with a negative growth trend.
a Decline in Expected Earnings Clouds Its Value Outlook but Its Shares Are Expensive:
Exelixis has a trailing twelve month P/E ratio of 18.7, compared to an average of 22.94 for the Health Care sector. Based on its EPS guidance of $1.7, the company has a forward P/E ratio of 22.8. The -3.7% compound average growth rate of Exelixis's historical and projected earnings per share yields a PEG ratio of -5.08. This indicates that its shares are overvalued.Furthermore, Exelixis is likely overvalued compared to the book value of its equity, since its P/B ratio of 4.97 is higher than the sector average of 3.19. The company's shares are currently trading 118.5% below their Graham number. Ultimately, Exelixis's strong cash flows, decent earnings multiple, and healthy debt levels factor towards it being fairly valued, its elevated P/B ratio notwithstanding.
Exelixis Has an Average Rating of Buy:
The 19 analysts following Exelixis have set target prices ranging from $30.0 to $60.0 per share, for an average of $43.89 with a buy rating. The company is trading -14.8% away from its average target price, indicating that there is an analyst consensus of some upside potential.
Exelixis has an above average percentage of its shares sold short because 10.7% of the company's shares are sold short. Institutions own 96.6% of the company's shares, and the insider ownership rate stands at 2.25%, suggesting a large amount of insider shareholders. The largest shareholder is Blackrock Inc., whose 11% stake in the company is worth $1,123,906,328.