A strong performer from today's afternoon trading session is Uber Technologies, whose shares rose 3.5% to $99.86 per share. For those of you thinking about investing in the stock, here is a brief value analysis of the stock using the company's basic fundamental ratios.
a Decline in Expected Earnings Clouds Its Value Outlook but Trades Above Its Graham Number:
Uber Technologies, Inc. develops and operates proprietary technology applications in the United States, Canada, Latin America, Europe, the Middle East, Africa, and the Asia Pacific. The company belongs to the Real Estate sector, which has an average price to earnings (P/E) ratio of 27.31 and an average price to book (P/B) ratio of 1.94. In contrast, Uber Technologies has a trailing 12 month P/E ratio of 17.0 and a P/B ratio of 9.22.
Uber Technologies has moved 31.7% over the last year compared to 19.7% for the S&P 500 -- a difference of 12.0%. Uber Technologies has a 52 week high of $101.99 and a 52 week low of $59.33.
The Firm Has a Highly Leveraged Balance Sheet:
| 2019 | 2020 | 2021 | 2022 | 2023 | 2024 | |
|---|---|---|---|---|---|---|
| Revenue (M) | $13,000 | $11,139 | $17,455 | $31,877 | $37,281 | $43,978 |
| Operating Margins | -66% | -44% | -22% | -6% | 3% | 6% |
| Net Margins | -65% | -61% | -3% | -28% | 5% | 22% |
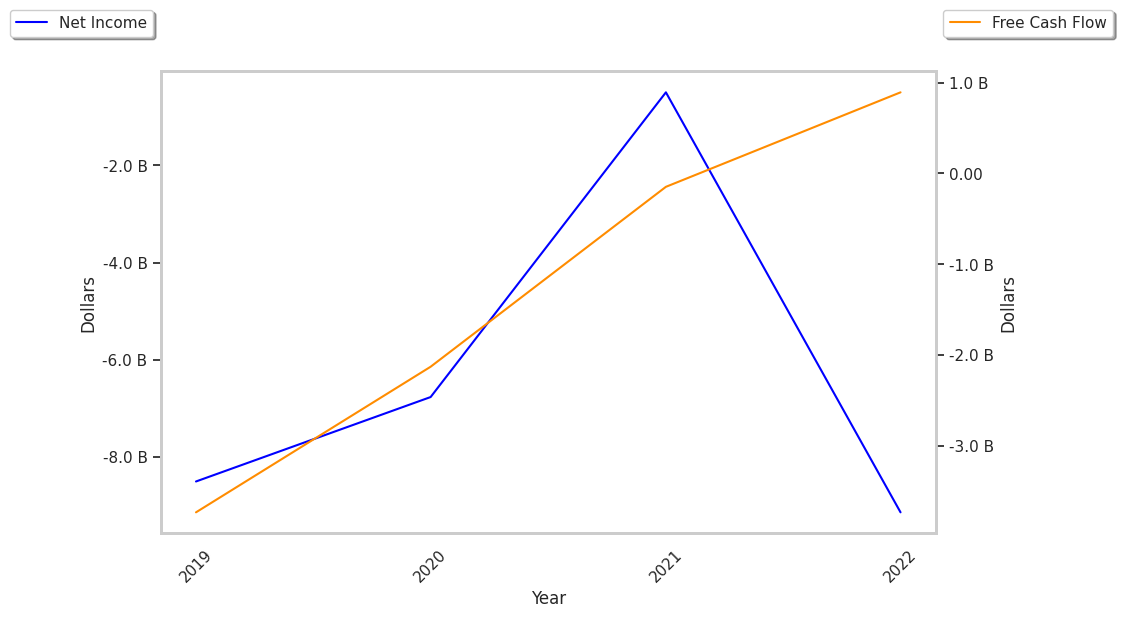
| Net Income (M) | -$8,506 | -$6,768 | -$496 | -$9,141 | $1,887 | $9,856 |
| Net Interest Expense (M) | $559 | $458 | $483 | $565 | $633 | $489 |
| Depreciation & Amort. (M) | $472 | $575 | $902 | $947 | $823 | $332 |
| Diluted Shares (M) | 1,248 | 1,753 | 1,896 | 1,975 | 2,092 | 2,151 |
| Earnings Per Share | -$6.81 | -$3.86 | -$0.29 | -$4.65 | $0.87 | $4.56 |
| EPS Growth | n/a | 43.32% | 92.49% | -1503.45% | 118.71% | 424.14% |
| Avg. Price | $35.54 | $35.51 | $48.61 | $30.9 | $61.57 | $99.66 |
| P/E Ratio | -5.22 | -9.2 | -186.96 | -6.66 | 66.2 | 21.16 |
| Free Cash Flow (M) | -$4,909 | -$3,361 | -$743 | $390 | $3,362 | $6,895 |
| CAPEX (M) | $588 | $616 | $298 | $252 | $223 | $242 |
| EV / EBITDA | -5.54 | -16.57 | -35.71 | -84.53 | 71.44 | 69.94 |
| Total Debt (M) | $11,498 | $15,474 | $18,664 | $18,626 | $19,019 | $17,922 |
| Net Debt / EBITDA | -0.08 | -2.29 | -4.9 | -16.29 | 7.42 | 3.84 |
| Current Ratio | 2.47 | 1.44 | 0.98 | 1.04 | 1.19 | 1.07 |
Uber Technologies has generally positive cash flows, rapidly growing revenues and decreasing reinvestment in the business, and positive EPS growth. However, the firm has a highly leveraged balance sheet. Finally, we note that Uber Technologies has weak operating margins with a stable trend and just enough current assets to cover current liabilities, as shown by its current ratio of 1.07.