Emerson Electric shares fell by -2.7% during the day's afternoon session, and are now trading at a price of $133.96. Is it time to buy the dip? To better answer that question, it's essential to check if the market is valuing the company's shares fairly in terms of its earnings and equity levels.
an Improvement in Earnings Next Year but Trades Above Its Graham Number:
Emerson Electric Co., a technology and software company, provides various solutions in the Americas, Asia, the Middle East, Africa, and Europe. The company belongs to the Technology sector, which has an average price to earnings (P/E) ratio of 30.44 and an average price to book (P/B) ratio of 4.19. In contrast, Emerson Electric has a trailing 12 month P/E ratio of 34.5 and a P/B ratio of 3.79.
Emerson Electric has moved 8.6% over the last year compared to 14.2% for the S&P 500 — a difference of -5.6%. Emerson Electric has a 52 week high of $150.27 and a 52 week low of $90.06.
The Company's Revenues Are Declining:
| 2019 | 2020 | 2021 | 2022 | 2023 | 2024 | |
|---|---|---|---|---|---|---|
| Revenue (M) | $18,372 | $16,785 | $12,932 | $13,804 | $15,165 | $17,492 |
| Gross Margins | 43% | 42% | 57% | 46% | 49% | 51% |
| Net Margins | 13% | 12% | 18% | 23% | 87% | 11% |
| Net Income (M) | $2,306 | $1,965 | $2,303 | $3,231 | $13,219 | $1,968 |
| Net Interest Expense (M) | -$174 | -$156 | -$155 | -$194 | -$34 | -$175 |
| Depreciation & Amort. (M) | $822 | $854 | $762 | $842 | $1,051 | $323 |
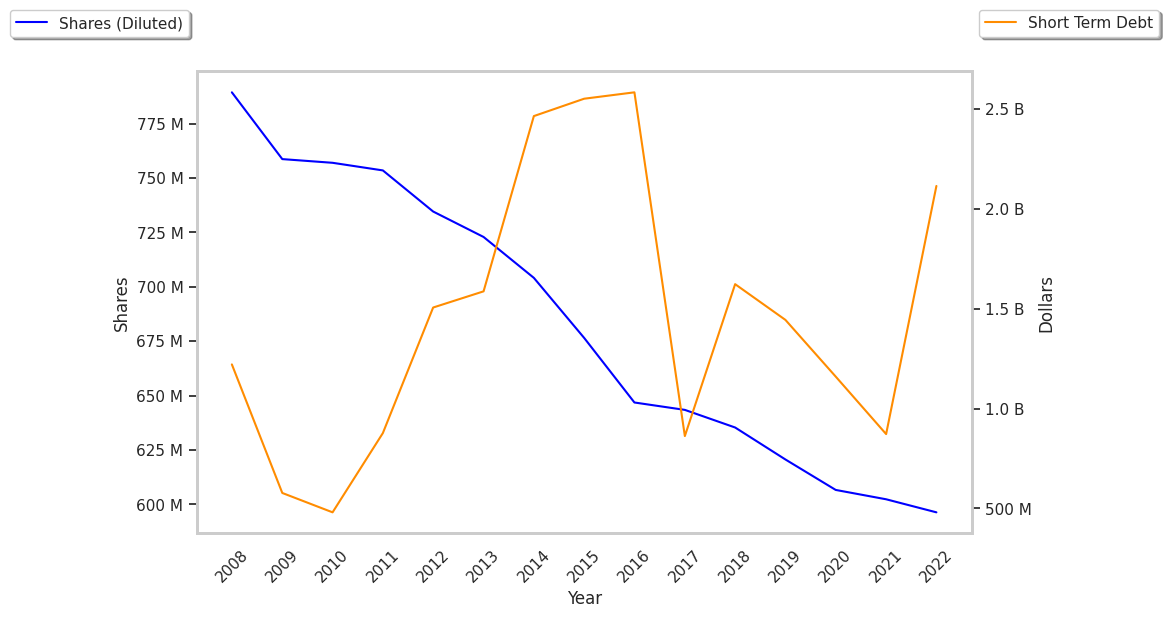
| Diluted Shares (M) | 614 | 602 | 598 | 587 | 573 | 571 |
| Earnings Per Share | $3.71 | $3.24 | $3.82 | $5.41 | $22.88 | $3.43 |
| EPS Growth | n/a | -12.67% | 17.9% | 41.62% | 322.92% | -85.01% |
| Avg. Price | $60.47 | $61.27 | $89.44 | $88.33 | $97.33 | $133.25 |
| P/E Ratio | 16.17 | 18.79 | 23.23 | 16.24 | 4.23 | 38.74 |
| Free Cash Flow (M) | $2,412 | $2,545 | $3,171 | $2,623 | $274 | $2,913 |
| CAPEX (M) | $594 | $538 | $404 | $299 | $363 | $419 |
| EV / EBITDA | 11.26 | 13.32 | 21.52 | 18.49 | 16.39 | 34.95 |
| Total Debt (M) | $6,261 | $8,043 | $5,830 | $10,567 | $11,383 | $8,753 |
| Net Debt / EBITDA | 1.26 | 1.83 | 0.44 | 2.53 | 2.35 | 2.53 |
| Current Ratio | 1.14 | 1.2 | 2.04 | 1.1 | 1.12 | 1.54 |
Emerson Electric has wider gross margins than its peer group, generally positive cash flows, and a decent current ratio of 1.54. However, the firm has slight revenue growth and decreasing reinvestment in the business. Finally, we note that Emerson Electric has flat EPS growth and significant leverage levels.