Unum logged a 1.6% change during today's morning session, and is now trading at a price of $77.53 per share.
Unum returned gains of 7.5% last year, with its stock price reaching a high of $84.48 and a low of $66.81. Over the same period, the stock underperformed the S&P 500 index by -6.9%. The company's 50-day average price was $75.97. Unum Group, together with its subsidiaries, provides financial protection benefit solutions in the United States, the United Kingdom, and Poland. Based in Chattanooga, TN, the Large-Cap Finance company has 10,833 full time employees. Unum has offered a 2.3% dividend yield over the last 12 months.
Low Leverage Levels but Positive Cash Flows:
| 2019 | 2020 | 2021 | 2022 | 2023 | 2024 | |
|---|---|---|---|---|---|---|
| Revenue (M) | $11,999 | $13,162 | $12,008 | $11,984 | $12,386 | $12,887 |
| Interest Income (M) | $177 | $188 | $185 | $188 | $195 | $201 |
| Operating Margins | 12% | 7% | 9% | 15% | 13% | 17% |
| Net Margins | 9% | 6% | 8% | 12% | 10% | 14% |
| Net Income (M) | $1,100 | $793 | $981 | $1,407 | $1,284 | $1,779 |
| Depreciation & Amort. (M) | $110 | $114 | $120 | $110 | $109 | $116 |
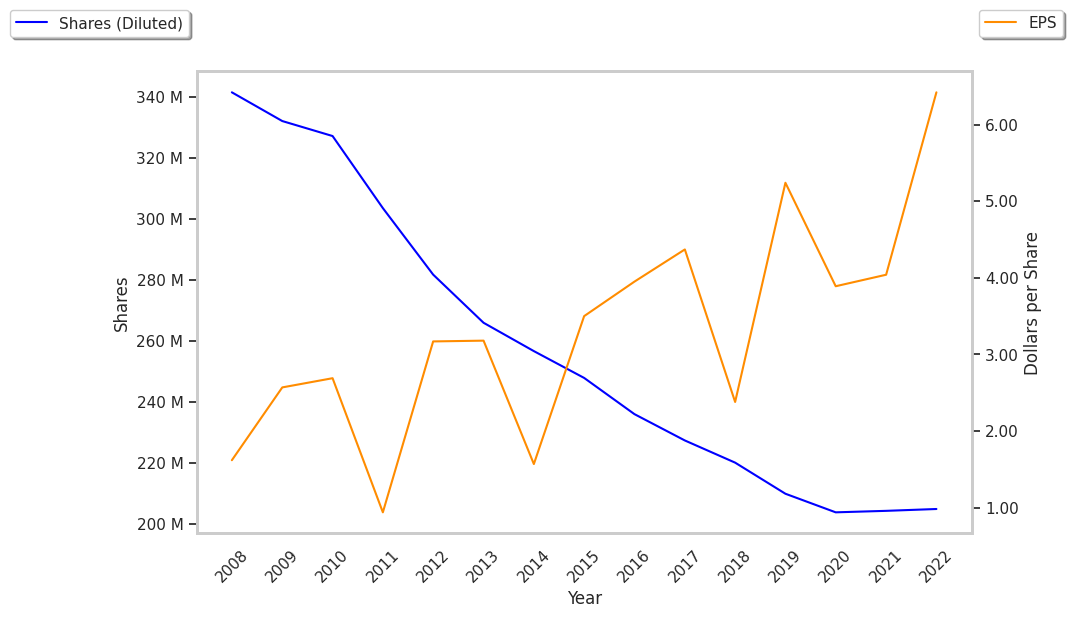
| Diluted Shares (M) | 210 | 204 | 205 | 202 | 198 | 188 |
| Earnings Per Share | $5.24 | $3.89 | $4.79 | $6.96 | $6.5 | $9.46 |
| EPS Growth | n/a | -25.76% | 23.14% | 45.3% | -6.61% | 45.54% |
| Avg. Price | $26.84 | $17.2 | $24.94 | $29.75 | $45.22 | $76.33 |
| P/E Ratio | 5.23 | 4.4 | 5.17 | 4.28 | 6.95 | 8.22 |
| Free Cash Flow (M) | $1,456 | $350 | $1,277 | $1,316 | $1,068 | $1,388 |
| CAPEX (M) | $151 | $119 | $110 | $102 | $135 | $126 |
| EV / EBITDA | 6.03 | 6.16 | 7.14 | 5.02 | 6.98 | 7.8 |
| Total Debt (M) | $3,327 | $3,346 | $3,442 | $3,430 | $3,430 | $4,014 |
| Net Debt / EBITDA | 2.17 | 2.92 | 2.85 | 1.78 | 1.88 | 1.63 |
Unum has strong operating margins with a positive growth rate, low leverage levels, and a strong EPS growth trend. Furthermore, Unum has slight revenue growth and a flat capital expenditure trend and positive cash flows.
Unum Has Attractive Multiples and Its Shares Are on Sale:
Unum has a trailing twelve month P/E ratio of 14.7, compared to an average of 15.92 for the Finance sector. Based on its EPS guidance of $9.04, the company has a forward P/E ratio of 8.4. The 8.1% compound average growth rate of Unum's historical and projected earnings per share yields a PEG ratio of 1.81. This suggests that these shares are overvalued. In contrast, the market is likely undervaluing Unum in terms of its equity because its P/B ratio is 1.2 while the sector average is 1.78. The company's shares are currently trading -30.4% above their Graham number.
Unum Has an Average Rating of Buy:
The 14 analysts following Unum have set target prices ranging from $81.0 to $115.0 per share, for an average of $93.71 with a buy rating. The company is trading -17.3% away from its average target price, indicating that there is an analyst consensus of some upside potential.
Unum has an average amount of shares sold short because 2.0% of the company's shares are sold short. Institutions own 93.1% of the company's shares, and the insider ownership rate stands at 0.95%, suggesting a small amount of insider investors. The largest shareholder is Vanguard Group Inc, whose 11% stake in the company is worth $1,446,626,916.