Today we're going to take a closer look at Large-Cap Telecommunications company Cisco Systems, whose shares are currently trading at $76.78. We've been asking ourselves whether the company is under or over valued at today's prices... let's perform a brief value analysis to find out!
Cisco Systems's Valuation Is in Line With Its Sector Averages:
Cisco Systems, Inc. designs, developes, and sells technologies that help to power, secure, and draw insights from the internet in the Americas, Europe, the Middle East, Africa, the Asia Pacific, Japan, and China. The company belongs to the Telecommunications sector, which has an average price to earnings (P/E) ratio of 18.22 and an average price to book (P/B) ratio of 1.86. In contrast, Cisco Systems has a trailing 12 month P/E ratio of 29.6 and a P/B ratio of 6.48.
Cisco Systems has moved 34.7% over the last year compared to 14.8% for the S&P 500 — a difference of 19.9%. Cisco Systems has a 52 week high of $79.5 and a 52 week low of $52.11.
The Company's Revenues Are Declining:
| 2019 | 2020 | 2021 | 2022 | 2023 | 2024 | |
|---|---|---|---|---|---|---|
| Revenue (M) | $51,904 | $49,301 | $49,818 | $51,557 | $56,998 | $53,803 |
| Gross Margins | 63% | 64% | 64% | 63% | 63% | 65% |
| Net Margins | 22% | 23% | 21% | 23% | 22% | 19% |
| Net Income (M) | $11,621 | $11,214 | $10,591 | $11,812 | $12,613 | $10,320 |
| Net Interest Expense (M) | $859 | $585 | $434 | $360 | $427 | $53 |
| Depreciation & Amort. (M) | $150 | $141 | $215 | $313 | $282 | $698 |
| Diluted Shares (M) | 4,273 | 4,244 | 4,243 | 4,116 | 4,087 | 4,013 |
| Earnings Per Share | $2.61 | $2.64 | $2.5 | $2.82 | $3.07 | $2.54 |
| EPS Growth | n/a | 1.15% | -5.3% | 12.8% | 8.87% | -17.26% |
| Avg. Price | $44.56 | $39.15 | $49.99 | $49.6 | $50.52 | $77.38 |
| P/E Ratio | 16.94 | 14.77 | 19.92 | 17.53 | 16.4 | 30.35 |
| Free Cash Flow (M) | $14,922 | $14,656 | $14,762 | $12,749 | $19,037 | $10,210 |
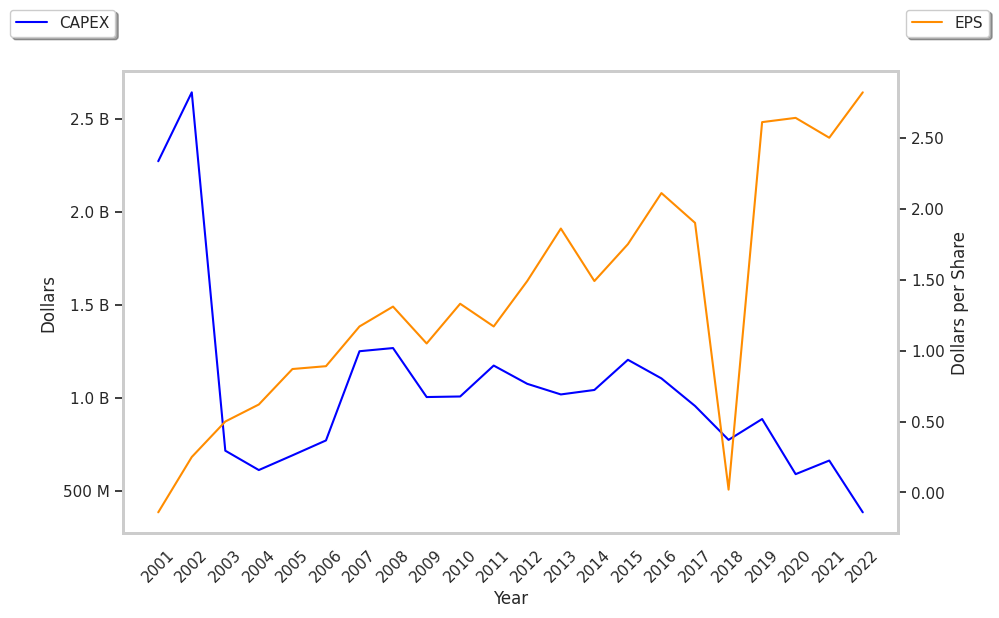
| CAPEX (M) | $909 | $770 | $692 | $477 | $849 | $670 |
| EV / EBITDA | 14.13 | 12.53 | 16.5 | 14.47 | 13.31 | 25.8 |
| Total Debt (M) | $22,497 | $17,571 | $12,010 | $10,127 | $8,640 | $32,481 |
| Net Debt / EBITDA | 0.97 | 0.49 | 0.34 | 0.2 | -0.06 | 1.82 |
| Current Ratio | 1.7 | 1.59 | 1.62 | 1.45 | 1.47 | 0.88 |
Cisco Systems has slight revenue growth and decreasing reinvestment in the business, positive cash flows, and not enough current assets to cover current liabilities because its current ratio is 0.88. On the other hand, the company benefits from wider gross margins than its peer group and healthy leverage levels. Furthermore, Cisco Systems has flat EPS growth.