Baxter International logged a 0.1% change during today's morning session, and is now trading at a price of $17.79 per share.
Baxter International returned losses of -45.4% last year, with its stock price reaching a high of $37.74 and a low of $17.4. Over the same period, the stock underperformed the S&P 500 index by -58.1%. AThe company's 50-day average price was $21.79. Baxter International Inc., through its subsidiaries, provides a portfolio of healthcare products in the United States. Based in Deerfield, IL, the Mid-Cap Health Care company has 38,000 full time employees. Baxter International has offered a 3.8% dividend yield over the last 12 months.
The Company's Revenues Are Declining:
| 2019 | 2020 | 2021 | 2022 | 2023 | 2024 | |
|---|---|---|---|---|---|---|
| Revenue (M) | $11,362 | $11,673 | $12,146 | $10,057 | $10,360 | $10,636 |
| Gross Margins | 42% | 39% | 39% | 35% | 40% | 37% |
| Net Margins | 9% | 9% | 11% | -24% | 26% | -6% |
| Net Income (M) | $1,001 | $1,102 | $1,284 | -$2,433 | $2,656 | -$649 |
| Net Interest Expense (M) | -$71 | -$134 | -$193 | -$395 | -$442 | -$341 |
| Depreciation & Amort. (M) | $789 | $823 | $867 | $1,072 | $984 | $259 |
| Diluted Shares (M) | 519 | 517 | 508 | 504 | 508 | 510 |
| Earnings Per Share | $1.93 | $2.13 | $2.53 | -$4.83 | $5.23 | -$1.27 |
| EPS Growth | n/a | 10.36% | 18.78% | -290.91% | 208.28% | -124.28% |
| Avg. Price | $74.89 | $79.88 | $77.58 | $75.43 | $38.66 | $17.77 |
| P/E Ratio | 38.02 | 36.81 | 30.3 | -15.62 | 7.36 | -13.99 |
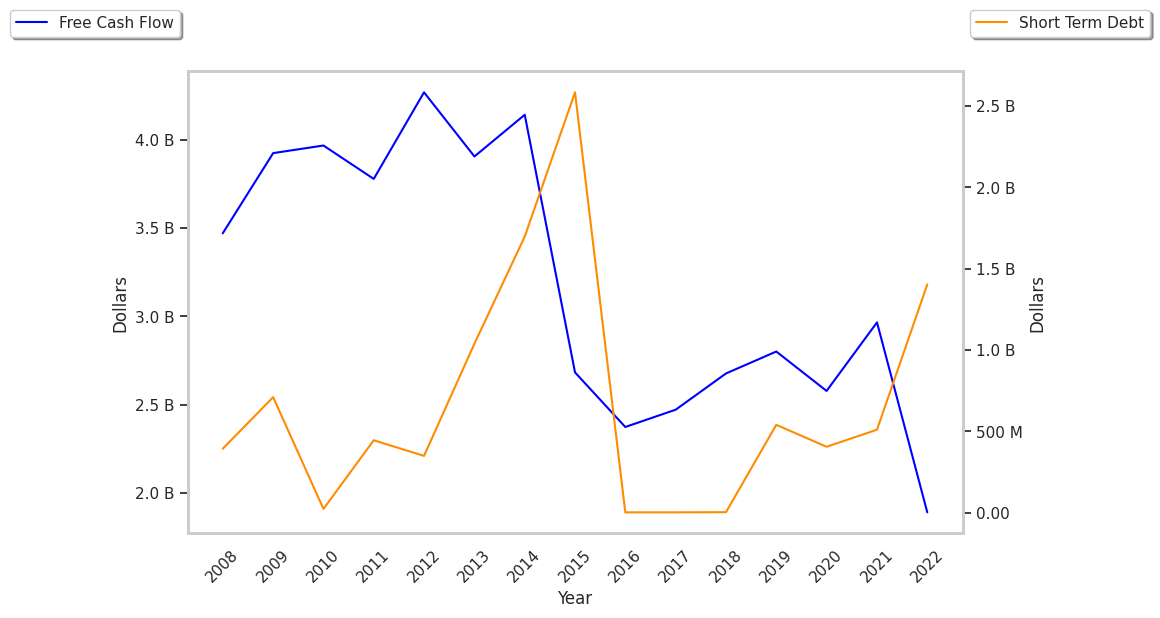
| Free Cash Flow (M) | $1,408 | $1,159 | $1,531 | $834 | $1,294 | $573 |
| CAPEX (M) | $696 | $709 | $691 | $377 | $432 | $446 |
| EV / EBITDA | 15.69 | 17.81 | 24.45 | -30.5 | 19.49 | 77.17 |
| Total Debt (M) | $5,124 | $6,639 | $17,964 | $17,807 | $16,523 | $13,806 |
| Net Debt / EBITDA | 0.7 | 1.19 | 6.77 | -9.13 | 7.95 | 44.11 |
| Current Ratio | 2.32 | 2.52 | 2.09 | 1.69 | 1.48 | 1.36 |
Baxter International suffers from declining revenues and decreasing reinvestment in the business, slimmer gross margins than its peers, and declining EPS growth. The firm's financial statements also exhibit positive cash flows and a highly leveraged balance sheet. Baxter International has just enough current assets to cover current liabilities, as shown by its current ratio of 1.36.
Baxter International does not have a meaningful trailing P/E ratio since its earnings per share are currently in the red. Based on its EPS guidance of $2.88, the company has a forward P/E ratio of 7.6. In comparison, the average P/E ratio for the Health Care sector is 22.94. On the other hand, the market is undervaluing Baxter International in terms of its equity because its P/B ratio is 1.26. In comparison, the sector average is 3.19.
Analysts Give Baxter International an Average Rating of Hold:
The 15 analysts following Baxter International have set target prices ranging from $19.0 to $42.0 per share, for an average of $24.07 with a hold rating. The company is trading -26.1% away from its average target price, indicating that there is an analyst consensus of strong upside potential.
Baxter International has an average amount of shares sold short because 7.4% of the company's shares are sold short. Institutions own 103.0% of the company's shares, and the insider ownership rate stands at 0.37%, suggesting a small amount of insider investors. The largest shareholder is Blackrock Inc., whose 15% stake in the company is worth $1,384,158,963.